The newsletter for climate-aware risk professionals.
The climate producing today's storms is not the climate that produced the historical record. Join 400+ risk professionals receiving the latest insights from Reask direct to their inbox.

Insights
Climate slicing with Reask unified models
Discover how Reask’s unified models use machine learning and climate data to simulate 2.5M years of synthetic extreme events.

Thomas Loridan
|
Chief Science Officer, Reask

Nicolas Bruneau
|
Co-Founder, Reask

From long-term trends in ocean temperatures and vegetation aridity to shorter-term fluctuations in steering currents and precipitation, the state of our climate plays a fundamental role in conditioning extreme weather risk globally.
To be useful in the context of a changing climate, trends in extreme weather need to be analysed within a framework that also describes the underlying climate as it evolves.
Unified models turn gridded climate input into global synthetic event sets
We started Reask with the goal of unifying all atmospheric perils under the same modelling system. Using machine learning-based climate patterns to link regions and perils globally, our models provide a connected picture of extreme weather probabilities across an extensive range of climate environments.
Over the past seven years, we have been hard at work assembling the first building block with our Unified Tropical Cyclone (UTC) model. From global gridded climate variables such as sea surface temperatures (SSTs), vertical wind shear or wind steering currents, the UTC implements a series of ML algorithms that create climate-sensitive synthetic events:
Global climate patterns (e.g. La Niña) and basin-level conditions (e.g. warm SSTs) shift the annual frequency distributions of modelled events.
Regional anomalies of SSTs and wind shear affect their likelihood of genesis.
Trends in wind steering currents influence event track trajectories.
Regional SST and wind shear conditions alter event intensification patterns.
In 2026, we are opening access to the second block of our unified modelling system: US wildfire. Consistent with tropical cyclones, we have adopted a top-down modelling approach where patterns of relevant climate variables condition wildfire activity regionally.
Here, the level of activity is measured by the annual burnt area, and climate connectors are based on vapour pressure deficit (VPD), relative humidity (RH), as well as precipitation and soil moisture patterns.
Fig. 1: Reask unified models turn over 10,000 years of climate data into 2.5 million years of synthetic extreme event data.
Climate slicing to condition your view of risk
The framework above allows our unified models to be efficiently deployed across a wide range of input climate conditions. They are designed to jointly explore three levels of uncertainty when quantifying extreme weather risk:
Global Mean Surface Temperature (GMST) level – how warm is the climate system? This can be measured in degrees above pre-industrial levels (see below), or alternatively by providing a timeline and emissions scenario.
Climate variability, given a GMST level – what is the state of the climate system under a specific level of warming? For example, a La Niña year under a +1.5 °C world versus an El Niño year will have different impacts on North Atlantic hurricane activity.
Variability in the characteristics of extreme weather events, given both of the above (i.e. weather variability) – what are the likely characteristics of extreme weather events under a given climate state and warming level? For example, the number, location and intensity of hurricanes in a La Niña year with +1.5 °C warming will vary depending on the state of the weather that season (all physical processes occurring at scales not captured in the forcing climate data).
To sample across the three dimensions above, we deploy our unified models with a range of climate model outputs as forcing. We cover dimension 1 by using outputs from 1900 to 2100 (0–4 °C warming, see x-axis below); dimension 2 from 50 different ensemble members of the NCAR CESM-LENS (z-axis); and dimension 3 by repeatedly sampling 250 times each climate input year with the UTC algorithms (stochastic sampling, y-axis).
The result is a database of 2.5 million stochastic years, from which users can subsample climate-conditioned views of risk. The example below shows extraction of a view of risk characteristic of a La Niña year in a +1.5 °C environment.
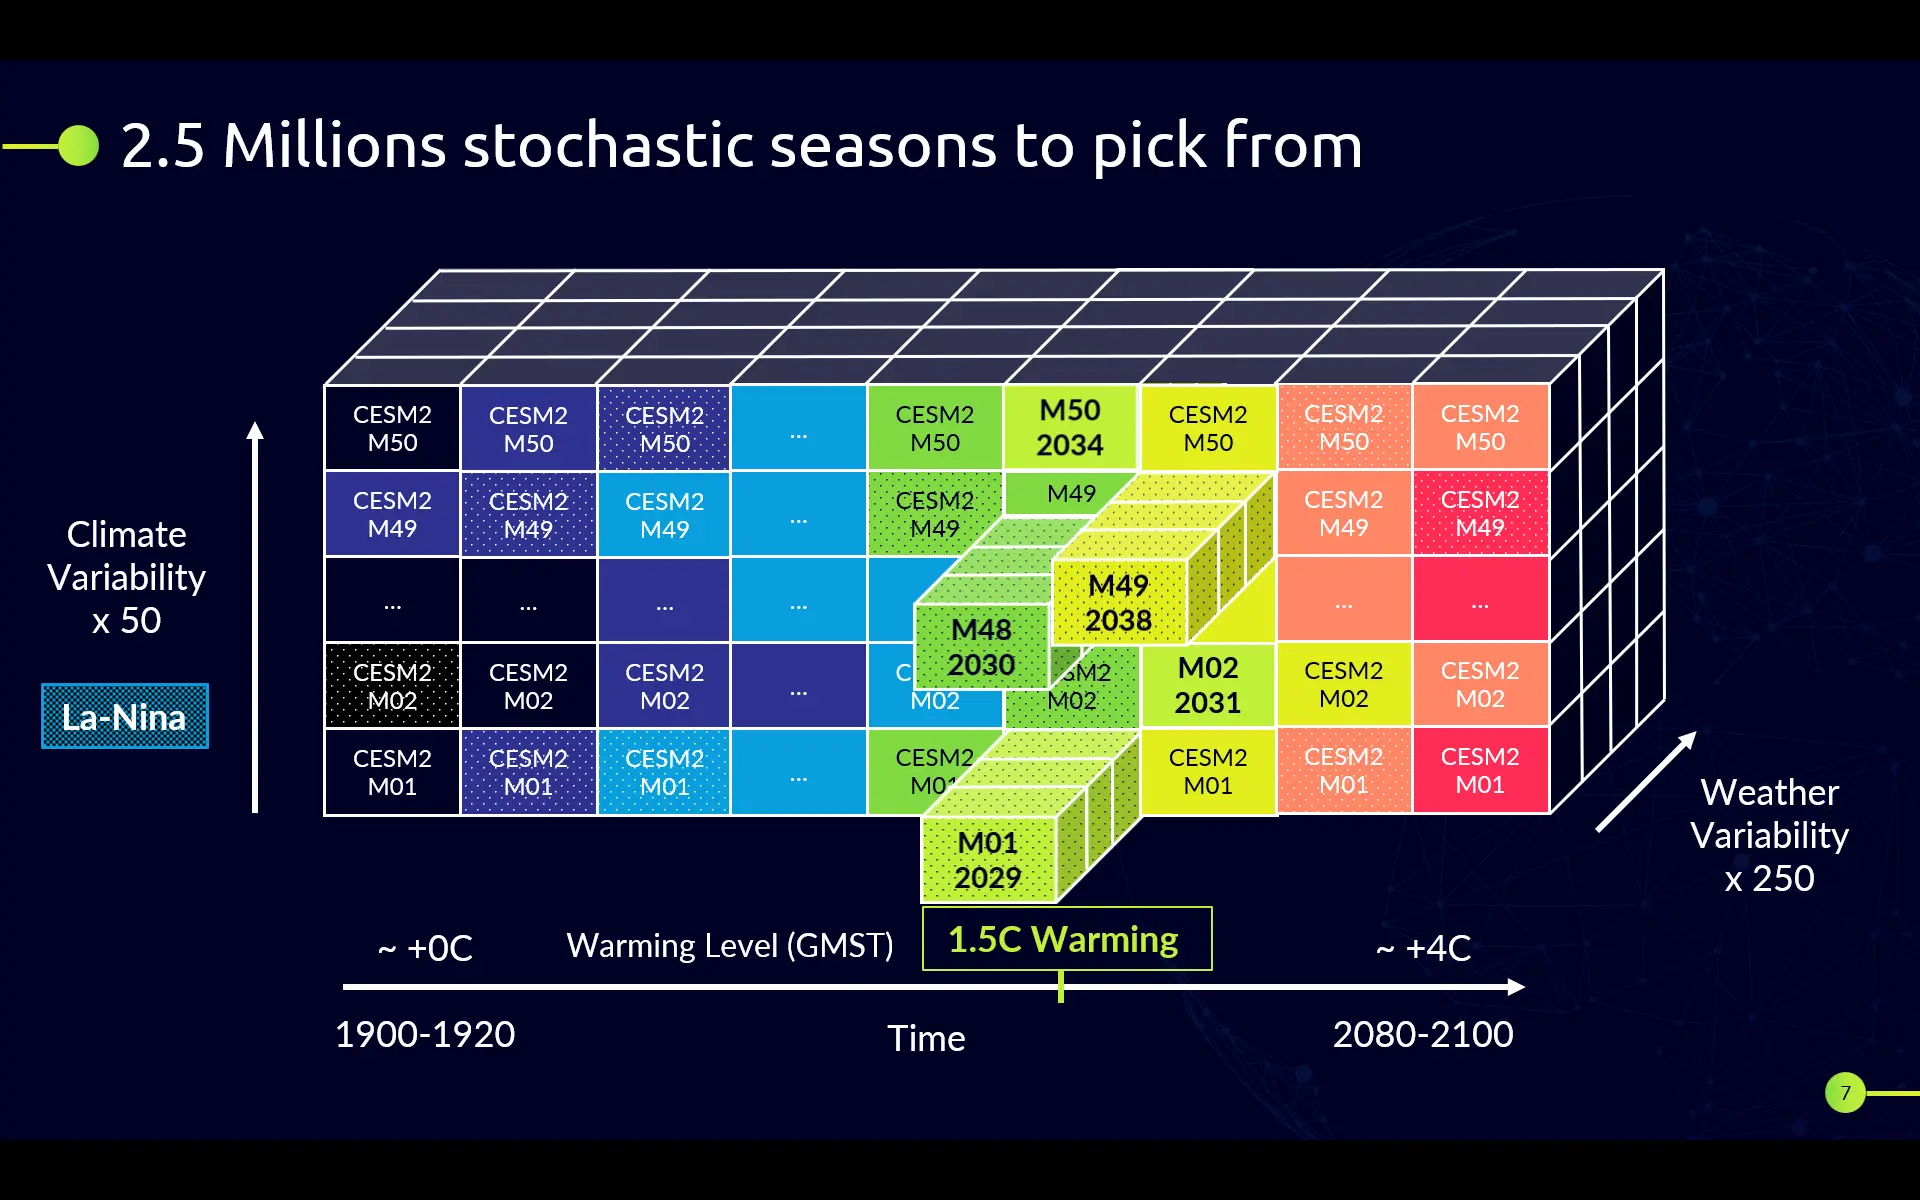
Fig. 2: Climate slicing hypercube illustrating the depth of climate variability available from Reask unified model outputs.
Here is a range of other slices typically queried by Reask users in the North Atlantic:
SST levels above given thresholds in specific regions (e.g. MDR, Gulf or East Coast US).
Vertical wind shear below or above specific thresholds (e.g. in the Caribbean).
Strength of the Bermuda high above or below thresholds, affecting steering conditions towards the US East Coast (e.g. straight-movers vs curvers).
Range of Global Mean Surface Temperature (GMST) relative to pre-industrial levels (e.g. +1.5 °C vs +2 °C).
Linking tropical cyclone and wildfire risk
Now on to the next chapter of innovation: by simulating additional atmospheric perils under the same unified modelling system, we can start to address questions around peril correlation, both regionally and globally. Importantly, the modelled connections can be traced back to trends in key thermodynamic and synoptic drivers, instead of relying on prescribed statistical trends derived from historical records.
In the example below, we show how observed variability in SST in the Main Development Region (MDR) relates to shifts in modelled distributions of US named storm landfalls (red box-and-whiskers), while trends in VPD influence modelled burnt area in California. Bootstrapped observation records over the period are shown as green dots.
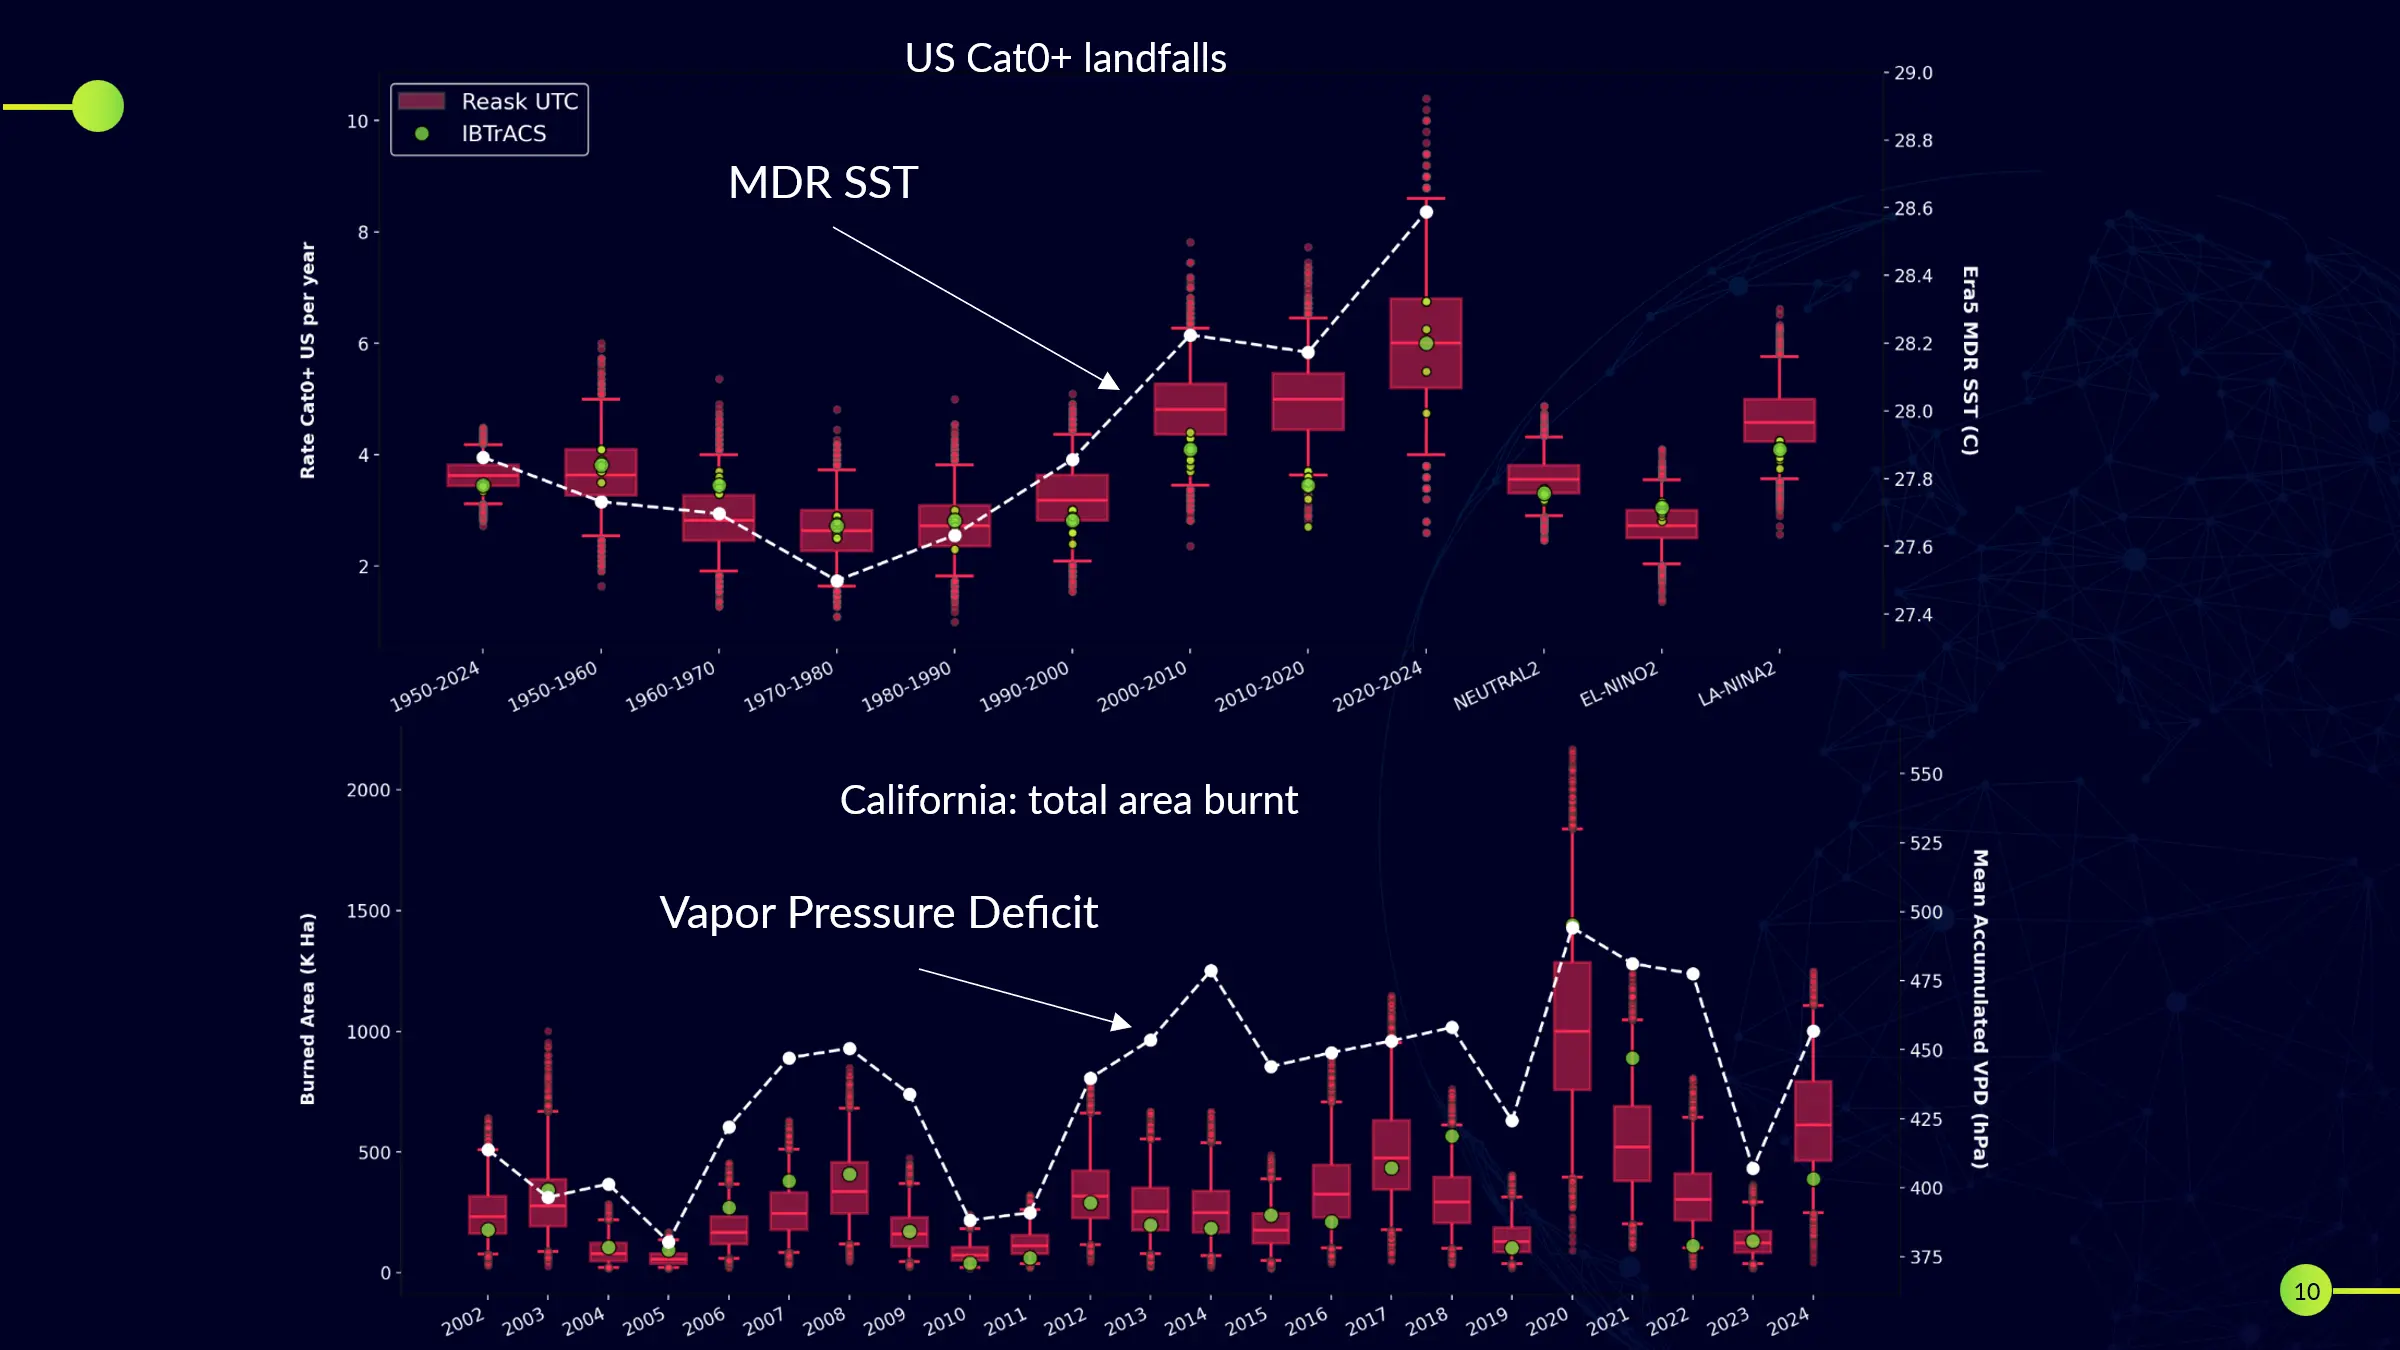
Fig. 3: Trends in annual named storm landfalls in the US (upper panel) and total burnt area in California (lower panel) can be linked to underlying changes in climate metrics such as sea surface temperature (SST, upper panel) or vapour pressure deficit (VPD, lower panel).
Thanks to these fundamental climate links, users can identify conditions that favour correlation of risk, or reveal natural hedging patterns, across their portfolios.
What macro and regional climate conditions can jointly drive hurricane risk in the Gulf and wildfire risk in California in a given year?
How often do these conditions occur, and what is the likely tail-risk impact?
How can I adapt my portfolio to minimise that tail risk through regional diversification?
None of these questions can be answered with traditional catastrophe models. We are building unified models to solve this from the underlying physics.


