The newsletter for climate-aware risk professionals.
The climate producing today's storms is not the climate that produced the historical record. Join 400+ risk professionals receiving the latest insights from Reask direct to their inbox.

Insights
Why a good trigger alone is not enough
Learn why aligning pricing and payout models is essential to scaling parametric insurance with transparency and confidence.

David Schmid
|
Global Head of Data Products

One of the challenges holding back parametric insurance is often overlooked: the disconnect between how event severity is modelled during pricing and how it is calculated during payout.
Setting the scene
This blog focuses on modelled, intensity-based parametric triggers. These triggers model hazard parameters to determine the payout, rather than using the raw observed parameters directly (which would be considered pure parametric triggers).
They include:
modelled wind speed
modelled rainfall
modelled shaking intensity
modelled impacted population
modelled loss
modelled flood footprints
These trigger types tend to be more sophisticated and granular (i.e. they model the intensity at the risk at typically 1x1km resolution) — and thus, more appealing for clients who care about spatial precision or impact relevance. But they also come with unique pricing challenges that simpler triggers (like Cat-in-a-Circle) do not face.
There is a related family of modern parametric triggers that rely on IoT sensors (e.g., wind sensors, water-level sensors) or satellite-derived measurements (e.g., flood extent, burned area). These face the same pricing–payout consistency issue — and an additional difficulty: they often have only a short historical record, making meaningful back-testing very limited.
Why Cat-in-a-Circle triggers are different — and why this blog is not about them
Simple index triggers such as Cat-in-a-Circle (CIC) have one key advantage: A stochastic Cat-3 entering the circle will trigger the same payout as a real Cat-3 entering that circle. In other words, the pricing methodology is fully aligned with the payout methodology.
This built-in consistency is highly valued by risk carriers and is one reason why CIC triggers are so popular.
However, CIC triggers come with other limitations — such as basis risk, binary outcomes, and coarse hazard representation — and these are not the focus of this blog.
Here, as the title suggests, we focus on the “good” triggers — the sophisticated, intensity-based designs that aim to reduce basis risk. For these triggers, pricing consistency is often not built in, and getting it right becomes critical for scale.
Why many triggers lack a consistent probabilistic counterpart
No probabilistic model exists
In such cases, pricing is often done by fitting an extreme-value distribution to a set of historical data.
This approach can work, provided the historical data are consistent with the trigger itself (for example, using gridded precipitation data to assess a lack-of-rainfall trigger) and the threshold triggers frequently enough (i.e. “at the money”).
This also enables historical backtesting, as long as non-stationarity in the data is properly accounted for.
However, in many cases, the historical data serve only as a proxy for the trigger because no direct historical record exists.
This issue particularly affects triggers based on newer sensor technologies that lack a long observational history.
If available, one can still use corresponding hazard maps as a reference, but that remains a broad approximation rather than a true representation of the trigger behaviour.
A probabilistic model exists, but was built for a different purpose.
This is common when a model designed for indemnity pricing is repurposed to price parametric covers.
Since parametric products are fundamentally hazard-driven, this approach introduces several problems:
The hazard module of indemnity models is often (mis)used to adjust frequencies and calibrate losses to historical experience. This works for indemnity pricing but creates bias when used for parametric pricing.
Even if it is possible to isolate the hazard module cleanly from the broader indemnity-model framework, the issue remains that the methodology used to compute wind speeds in that model does substantially differ from the one applied during the payout calculation.
Remember the Cat-3 example from a Cat-in-a-Circle trigger: a Cat-3 in the probabilistic model triggers the same payout as a real Cat-3 entering the circle.
Now contrast this with a modelled trigger priced using an indemnity model — a Cat-3 event in the probabilistic indemnity model will not generate the same windspeeds at the covered risk, because the trigger calculation is based on a separate, disconnected model. In other words, it will trigger a different payout than a real Cat-3 with identical track characteristics.
These inconsistencies may seem harmless, but in practice they introduce inefficiencies into pricing and, more importantly, inflate premiums through uncertainty loadings designed to compensate for the mismatch between modelled and realised payouts.
In other words, it's a barrier to scale.
If we want parametric insurance to grow into a mainstream risk-transfer instrument, this fundamental inconsistency needs to be resolved wherever possible, and certainly not at the expense of the trigger quality.
My perspective – with pricing glasses on
Having spent years pricing and structuring parametric covers for one of the world’s largest reinsurers, I’ve seen firsthand how methodological differences cascade into pricing uncertainty, often resulting in unattractive quotes.
If your hazard model for pricing and your trigger mechanism for payout are not aligned, you end up managing two independent sources of uncertainty:
one in frequency, and
one in severity.
In practice, this means higher technical pricing, wider confidence intervals, and reduced appetite to scale parametric products.
When pricing and trigger methodologies are consistent, however, the equation simplifies:
All uncertainty collapses into a single dimension: frequency.
The severity component effectively cancels out, turning pricing into a pure frequency assessment.
Once you see it, you can’t unsee it, and you’ll love it.
It's tempting to assume a “bias correction” can fix the mismatch. But bias corrections are typically linear, one-dimensional shifts based on only a few historical events. They cannot reproduce the complex, non-linear hazard characteristics driven by position, maximum wind speed, radius of maximum wind, asymmetry, or decay.
Reask’s consistent approach with Metryc and DeepCyc
At Reask, we’ve eliminated that disconnect and we’ve proven it works in reality.
Our extensive post-event validation against more than 500 observed anemometers across global basins shows excellent correlation between measured on the ground and modelled wind speeds.
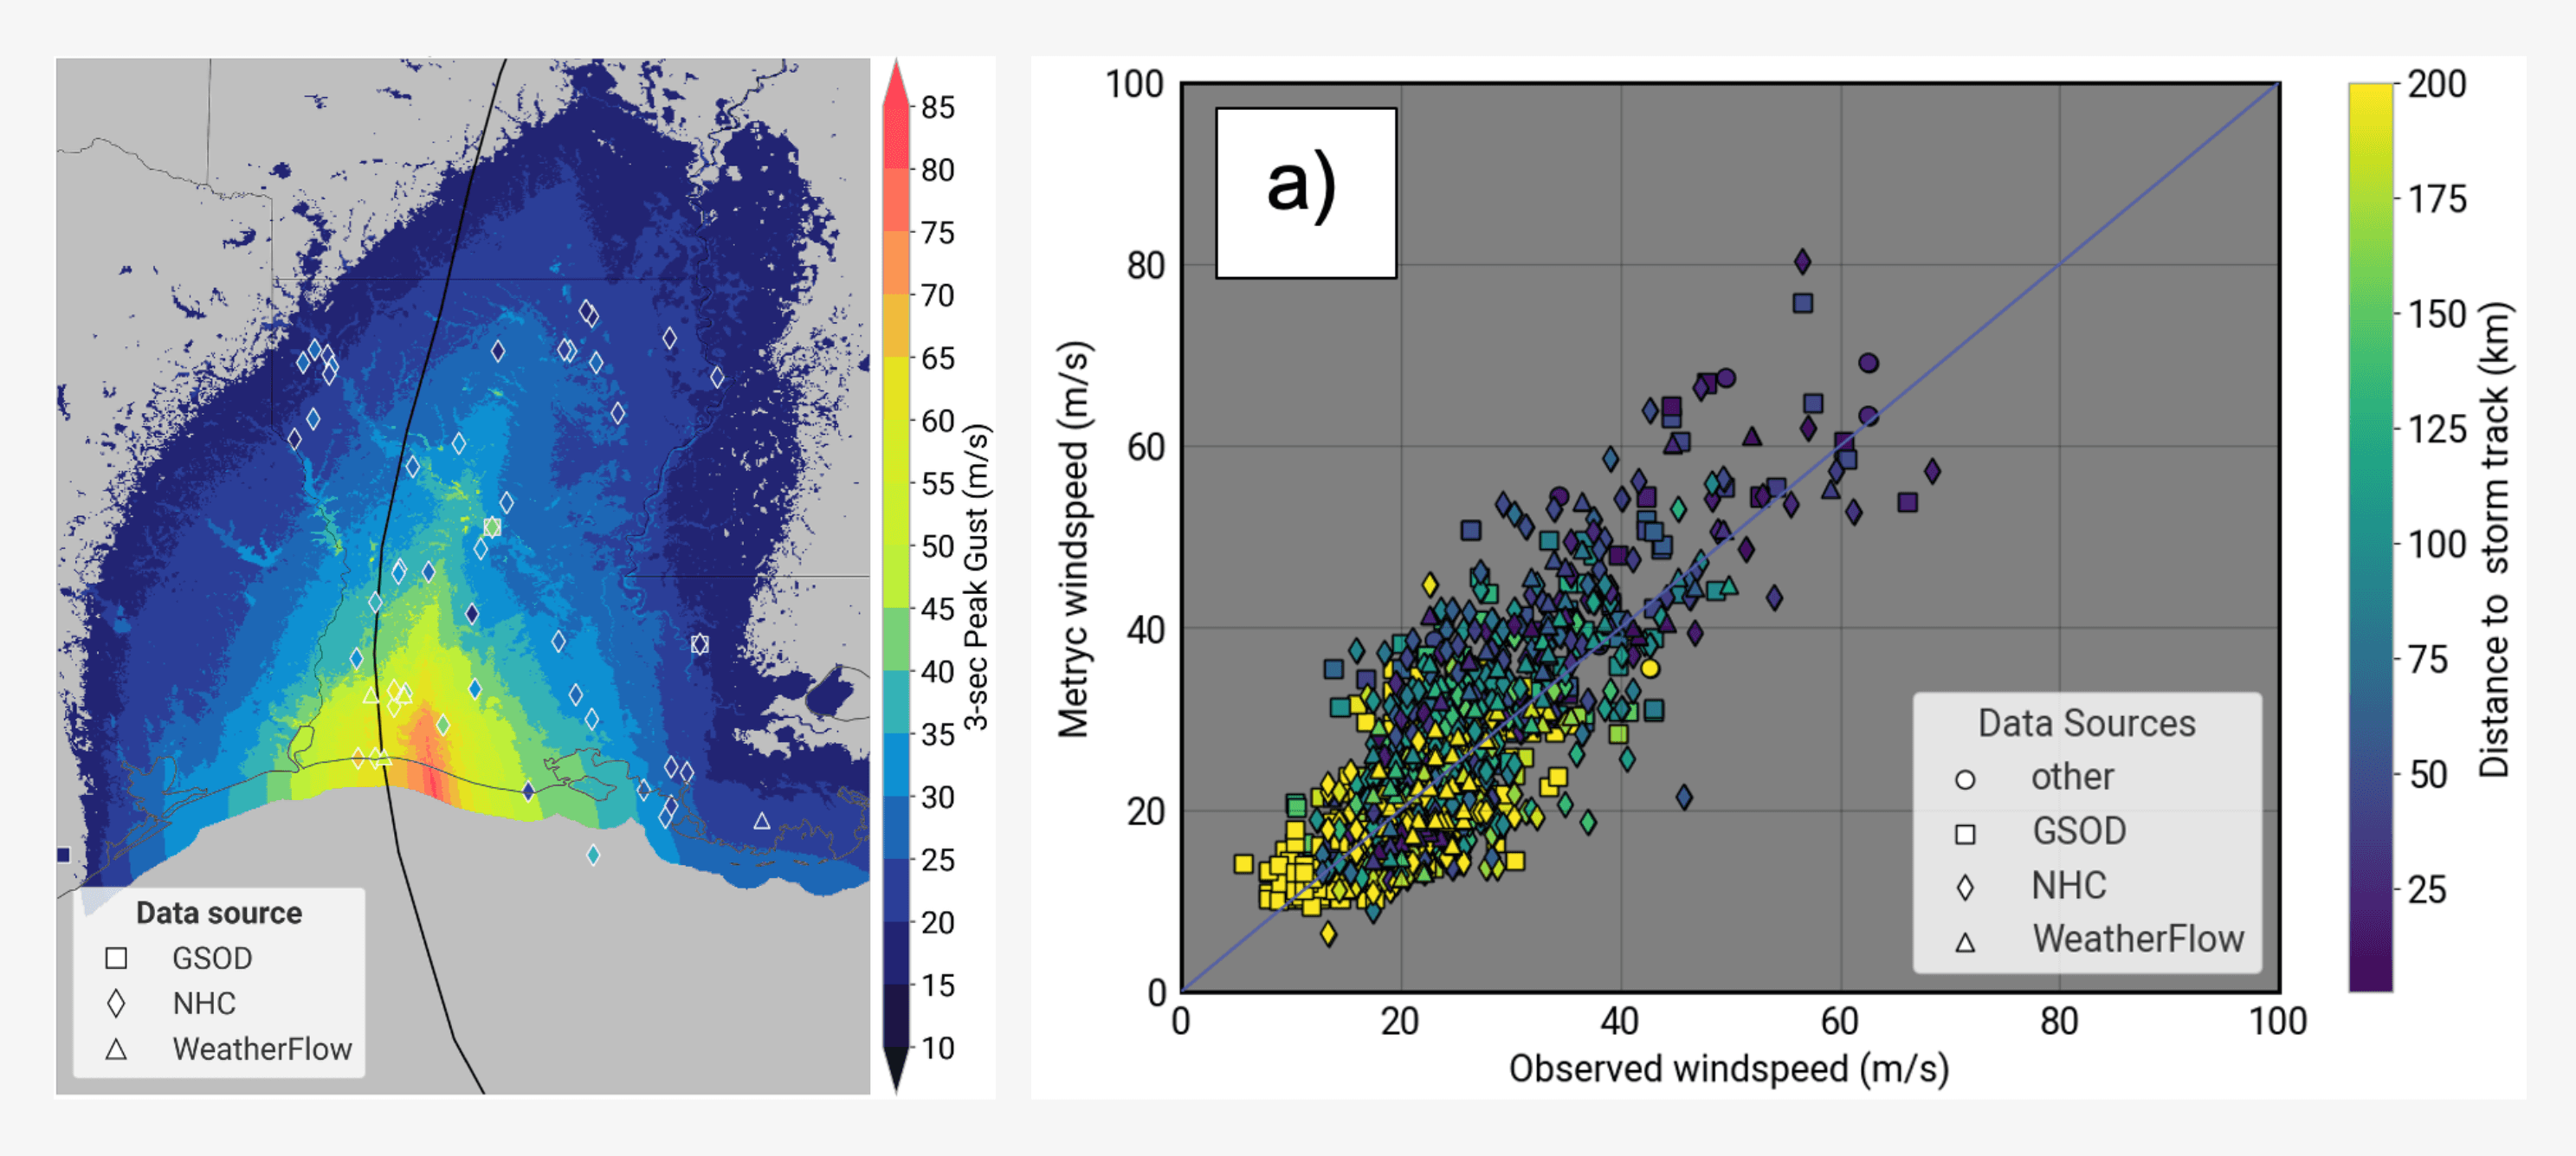
Figure 2: Validation plots comparing modelled Metryc wind speeds with observed wind speeds, showing strong correlation (left Metryc footprint of Laura 2020 and right comparison across multiple relevant US storms).
This demonstrates the robustness of our wind-field methodology, which is identically applied in both our probabilistic model (DeepCyc, used for pricing) and our post-event product (Metryc, used for payout validation).
That means the hazard intensity used to model your expected loss is generated in exactly the same way as the intensity that later determines your payout. For pricing actuaries on the risk-carrier side, the only remaining task is to challenge DeepCyc’s frequency assumptions.
With Metryc and DeepCyc, consistency is a modelling principle that ensures what you price is what you get when the payout comes due.
It removes unnecessary uncertainty loadings, enables simpler and more transparent pricing, and helps lower the barriers to scaling parametric insurance.


