The newsletter for climate-aware risk professionals.
The climate producing today's storms is not the climate that produced the historical record. Join 400+ risk professionals receiving the latest insights from Reask direct to their inbox.

Insights
From forecast to settlement: hurricane Melissa's 5-day timeline
Explore how Reask’s LiveCyc and Metryc models captured Hurricane Melissa’s evolution turning complex storm dynamics into actionable insights.

Thomas Loridan
|
Chief Science Officer, Reask

Balaji Mani
|
Principal Catastrophe Model Developer, Reask

As Hurricane Melissa threatened Jamaica last week, Reask’s LiveCyc provided users with continuously updated probabilistic forecasts that captured the evolving uncertainty as the storm approached. The progression of these forecasts offers a compelling demonstration of how ensemble-based scenario generation adapts as new information becomes available and forecast confidence increases.
Complementing these pre-landfall forecasts with rapid post-event wind footprints from Metryc, Reask’s suite of datasets captured Melissa’s complete lifecycle: from uncertain threat days before landfall to validated 1-kilometer resolution on the ground impacts within hours of the storm passing.
Day-3: maximum uncertainty (October 26, 06:00 UTC)
Three days before landfall, the forecast picture was at its most uncertain. The LiveCyc 1000-member ensemble displayed a wide range of possible tracks, with the official NHC forecast (white line with dots) pointing towards a landfall on the south coast of Jamaica. At this range, the system honestly represented the limits of atmospheric predictability.
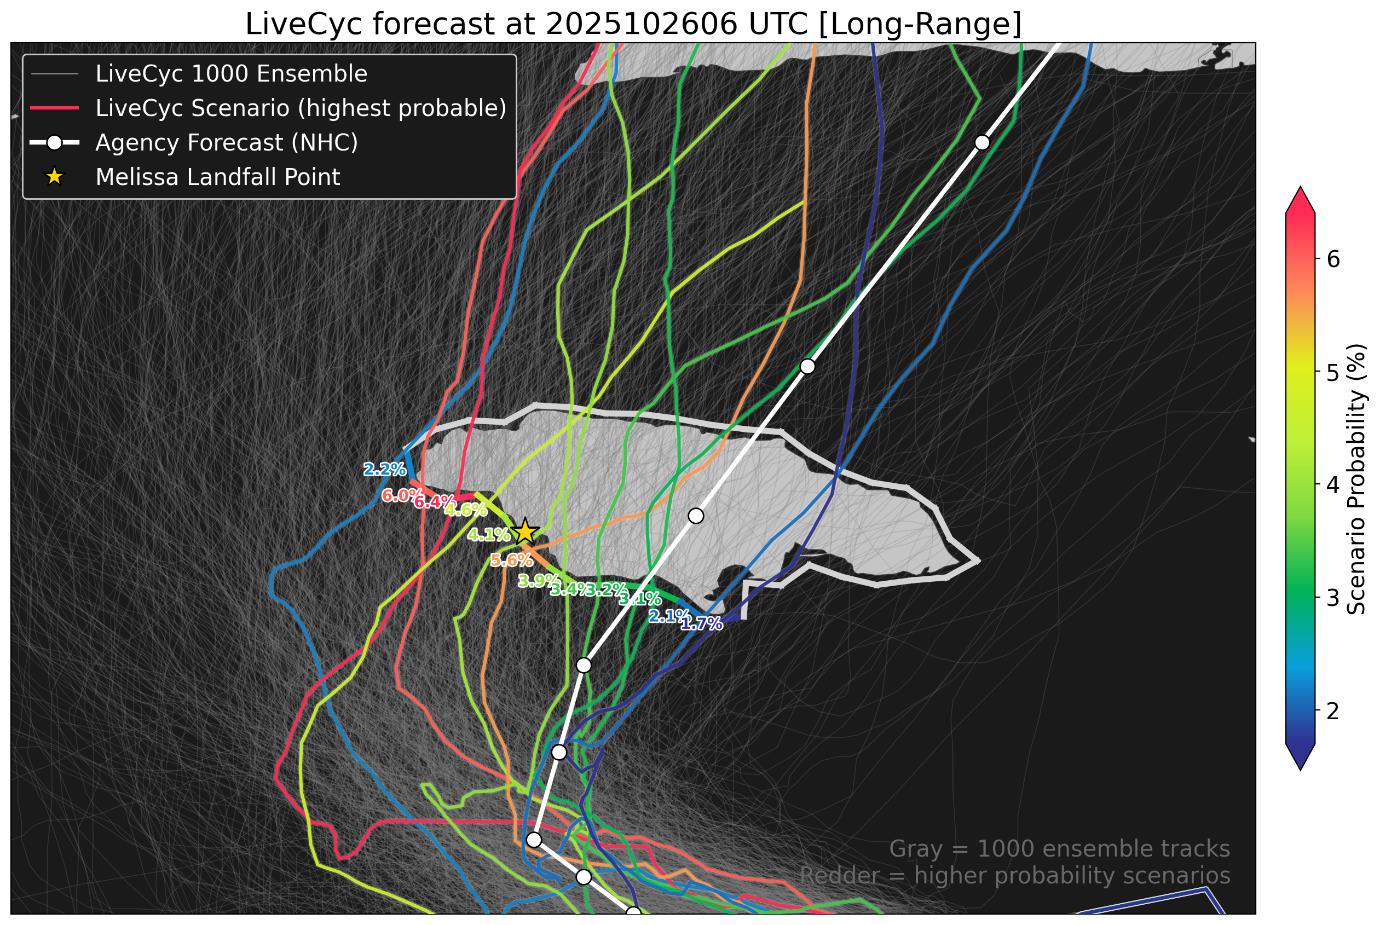
Figure 1: LiveCyc forecast at day-3, showing 1000 ensemble members (gray) with probability-weighted scenarios (colored tracks). The yellow star marks the actual landfall point, which fell within a 4-5% probability cluster at this early stage. White line shows the official NHC forecast.
The ensemble captured several distinct scenarios: tracks passing directly over Jamaica before recurving northeast, paths west of the island continuing northward, and even possibilities tracking further west toward Central America. Individual scenario probabilities ranged from just 2.5% to 6.9%, reflecting genuine uncertainty about which atmospheric steering pattern would ultimately dominate Melissa’s path.
The colored tracks show LiveCyc representative landfall scenarios and are color coded in terms of their probability of occurrence: warmer colors (reds and oranges) indicating higher-probability scenarios and cooler colors (blues) representing less likely but still physically plausible outcomes.
This wide distribution at day-3 is exactly what a probabilistic system should show: honest representation of forecast uncertainty, while still identifying the most likely evolution patterns. Notably, the eventual landfall location (marked with a yellow star) fell within one of the scenario clusters that showed 4-5% probability at this early stage.
Day-2: convergence begins (October 27, 06:00 UTC)
At 48 hours before landfall, the forecast began converging on Jamaica’s southern coast. The LiveCyc members showed tighter clustering around what would become the actual landfall point: a location that differed somewhat from the earlier NHC centerline. The scenario probabilities indicated approximately 16% likelihood of the storm tracking through the region where it ultimately made landfall (nearly triple the day -3 maximum), with the remaining probability distributed across neighboring coastal areas.
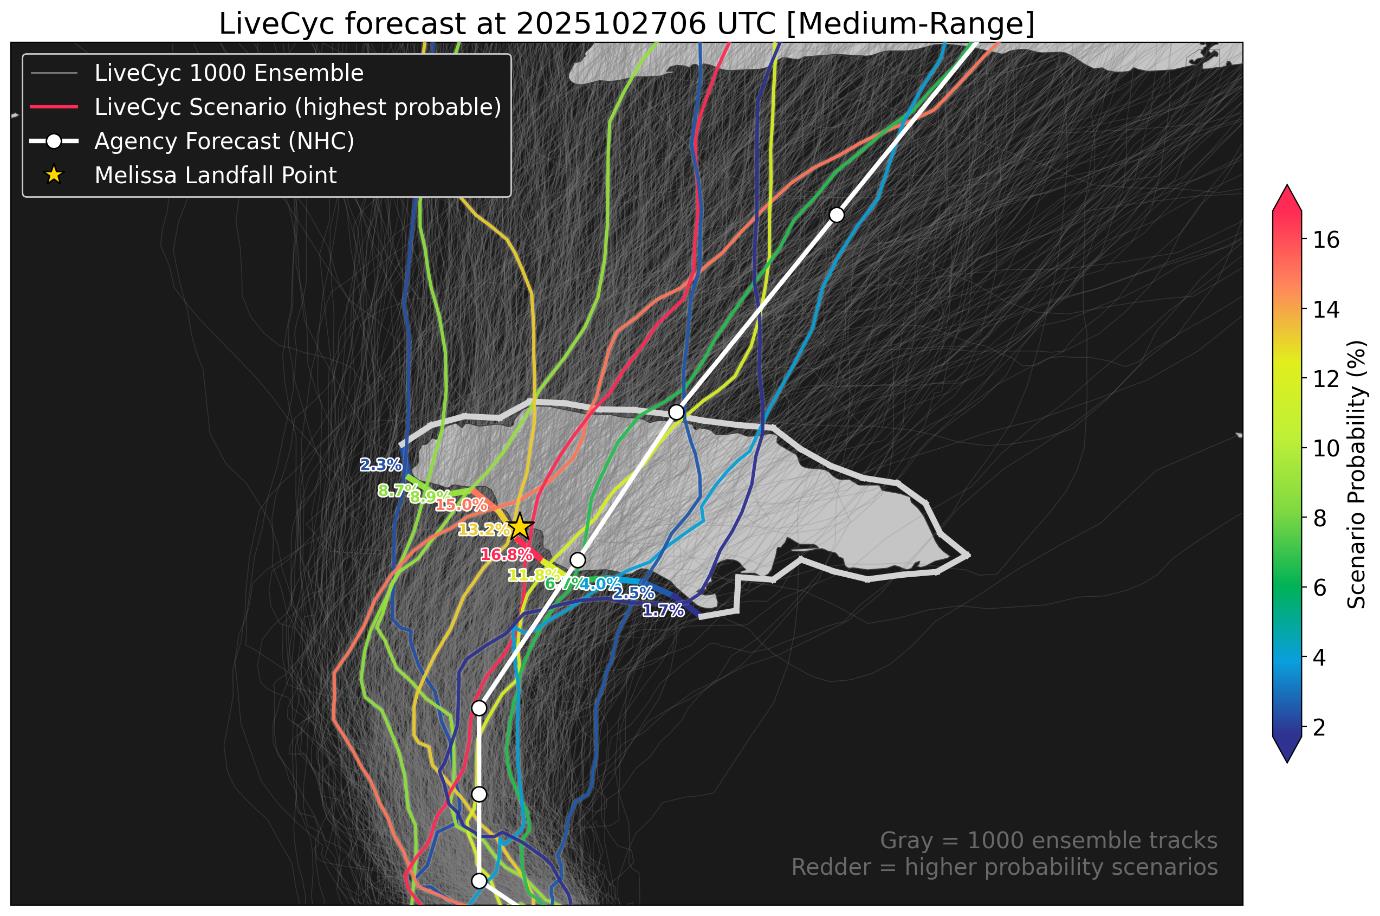
Figure 2: LiveCyc forecast at day-2 (see caption of Fig. 1 for details)
The most likely track cluster increasingly favored a path across Jamaica followed by a northeast recurvature. Scenarios tracking well west of Jamaica, while still present in the ensemble, had become notably less probable. The NHC official forecast remained well within the LiveCyc ensemble spread, and the convergence between the agency track and LiveCyc’s highest-probability scenarios was becoming more apparent.
This evolution reflects both the natural improvement in forecast skill at shorter lead times and the incorporation of new observational data into the forecast initialization. The actual landfall location (yellow star) now fell within a scenario cluster showing approximately 13% probability.
Day-1: clear signal emerges (October 28, 06:00 UTC)
By day-1, the forecast uncertainty had narrowed substantially. The highest-probability LiveCyc scenarios closely aligned with the eventual landfall location on Jamaica’s southern coast, with scenario probabilities reaching 23-25% for tracks passing through the actual impact zone. The NHC official forecast had also shifted toward this solution, but the scenario ensemble provided additional value by quantifying the distribution of potential wind speeds across the island’s property concentrations.
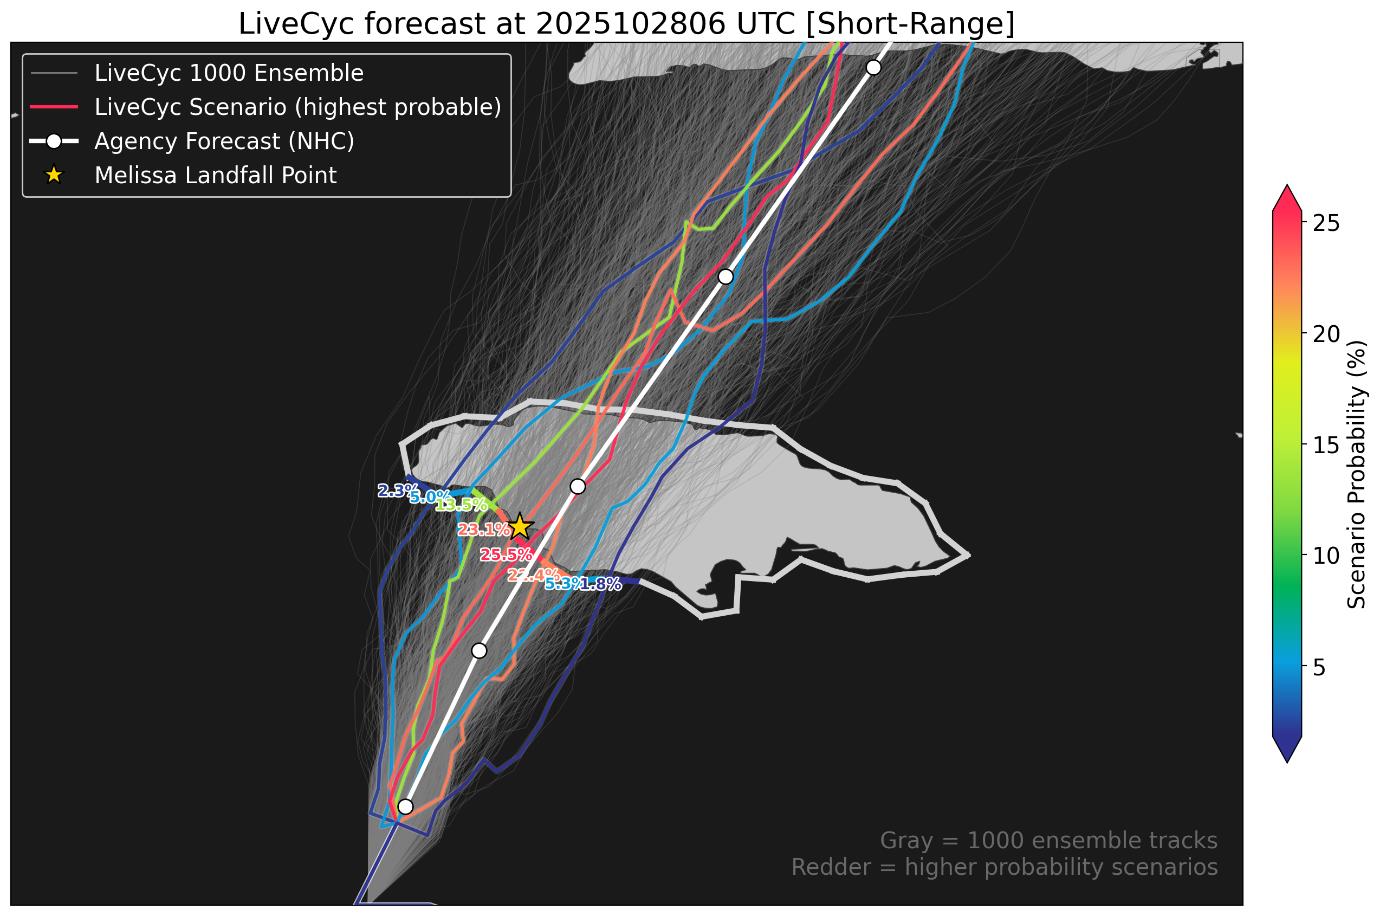
Figure 3: LiveCyc forecast at day-1 (see caption of Fig. 1 for details)
At this short range, the ensemble spread had contracted substantially, though important uncertainties remained about Melissa’s exact intensity at landfall and questions about post-landfall structure after interacting with Jamaica’s mountainous terrain. The colored probability tracks showed a clear preference for paths making landfall on Jamaica’s south-west coast near where the actual landfall would occur hours later.
The rapid narrowing of uncertainty between day-2 and day-1 demonstrates the critical value of that final 24-hour forecast update before impact. This is when forecast confidence typically increases most dramatically. The actual landfall point (yellow star) now fell squarely within the highest-probability scenario cluster, showing probabilities up to 25%.
Importantly, each LiveCyc scenario comes with its own 1-kilometer resolution wind footprint, providing detailed spatial information about potential impacts for every case. For example, the 25.5% probability scenario shown produces peak 3-second gusts exceeding 200 kph across western Jamaica, with complex spatial patterns driven by terrain interaction captured at 1km resolution.
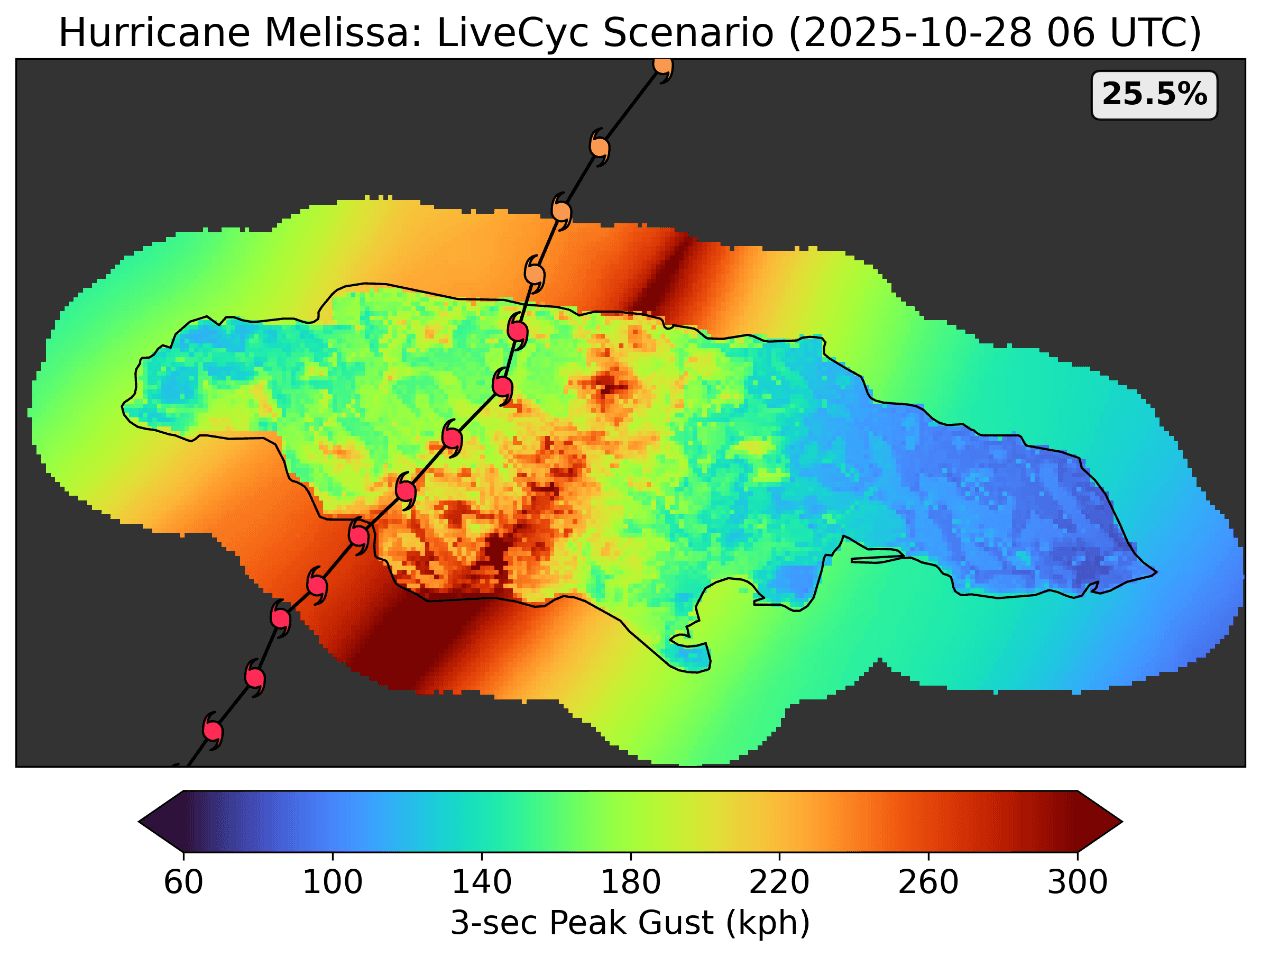
Figure 4: Wind footprint for the highest probability LiveCyc scenario at day-1, showing peak 3-second gusts at 1km resolution. Track colored by intensity category. Note each LiveCyc scenario includes such detailed wind field estimates across the entire impact region.
Landfall day (day+0): Metryc interim (within 12 hours of landfall)
Within twelve hours of Melissa making landfall on Jamaica’s southern coast, Reask’s Metryc interim product delivered an immediate high-resolution wind footprint at 1-kilometer spatial resolution. This initial assessment utilized best-track data from 6-hourly official observations combined with our well-validated ML-based wind field model to reconstruct peak 3-second gust speeds across the entire island.
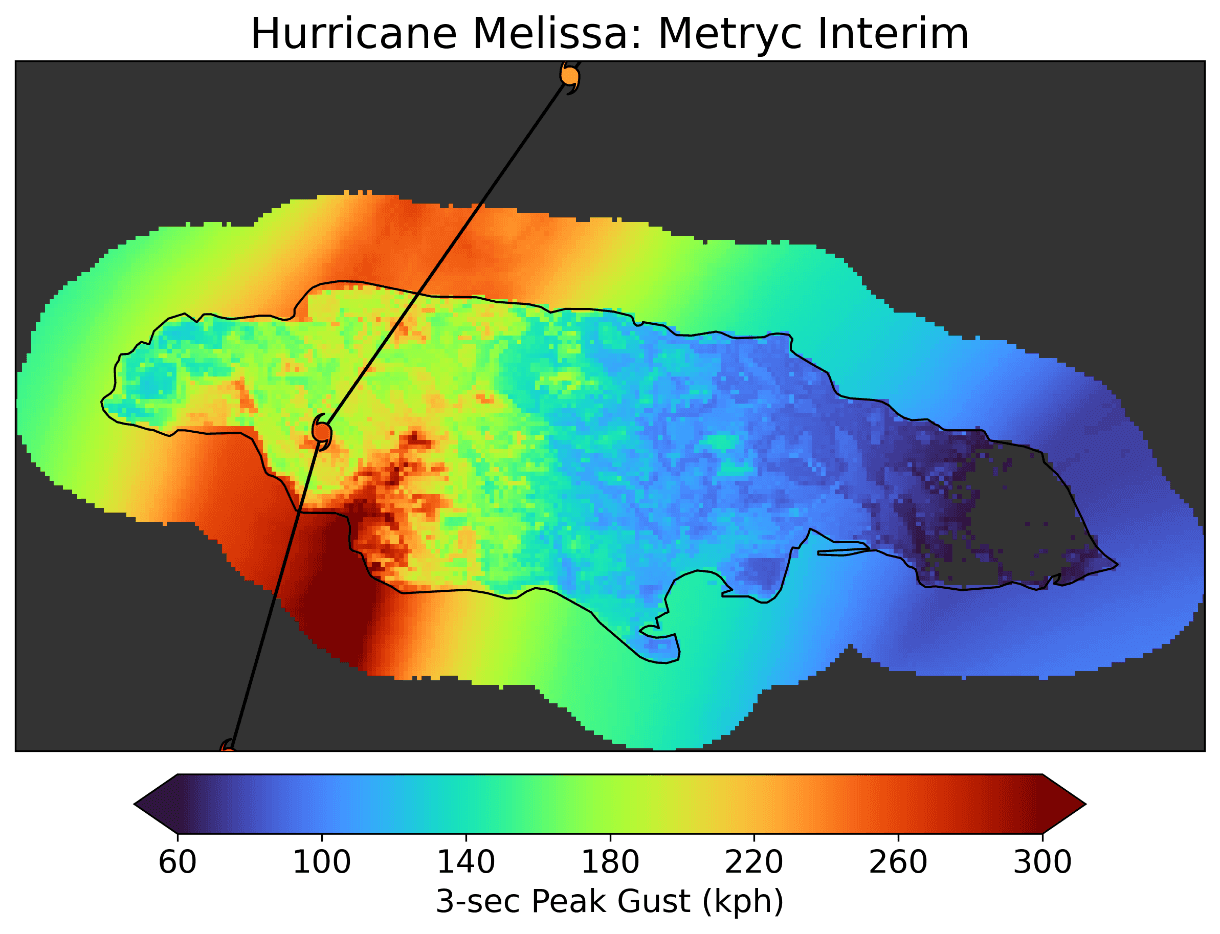
Figure 5: Metryc interim wind footprint delivered within 12 hours of landfall, showing peak 3-second gusts at 1km resolution, based on 6-hourly best-track positions (“b-deck”, black line with dots).
The Metryc Interim footprint revealed wind speeds ranging from tropical storm force gusts (60-100 kph) across portions of eastern Jamaica (including the capital, Kingston, where peak observed gust were reported at 95kph) to severe hurricane gusts (150+ kph) in the core impact zone near the landfall point on the south-west coast.
The 1-kilometer resolution captured fine-scale variations driven by Jamaica’s complex topography. The island’s mountainous spine, rising to over 2,200 meters elevation, produced pronounced sheltering effects in interior valleys, with estimated gust speeds varying dramatically over short distances. This spatial detail represents a substantial advance over traditional approaches that apply uniform wind speed assumptions across broad regions, enabling rapid damage assessment even before comprehensive ground surveys can be completed.
Landfall day +1: Metryc post-landfall (within 48 hours)
The Metryc Post-Landfall product, delivered within 48 hours of landfall, incorporated additional information from aircraft reconnaissance data and hourly NHC public advisories. This enriched dataset captured intensity and track fluctuations occurring between the standard 6-hourly best-track positions, enabling a more accurate reconstruction of Melissa’s wind field evolution across Jamaica.
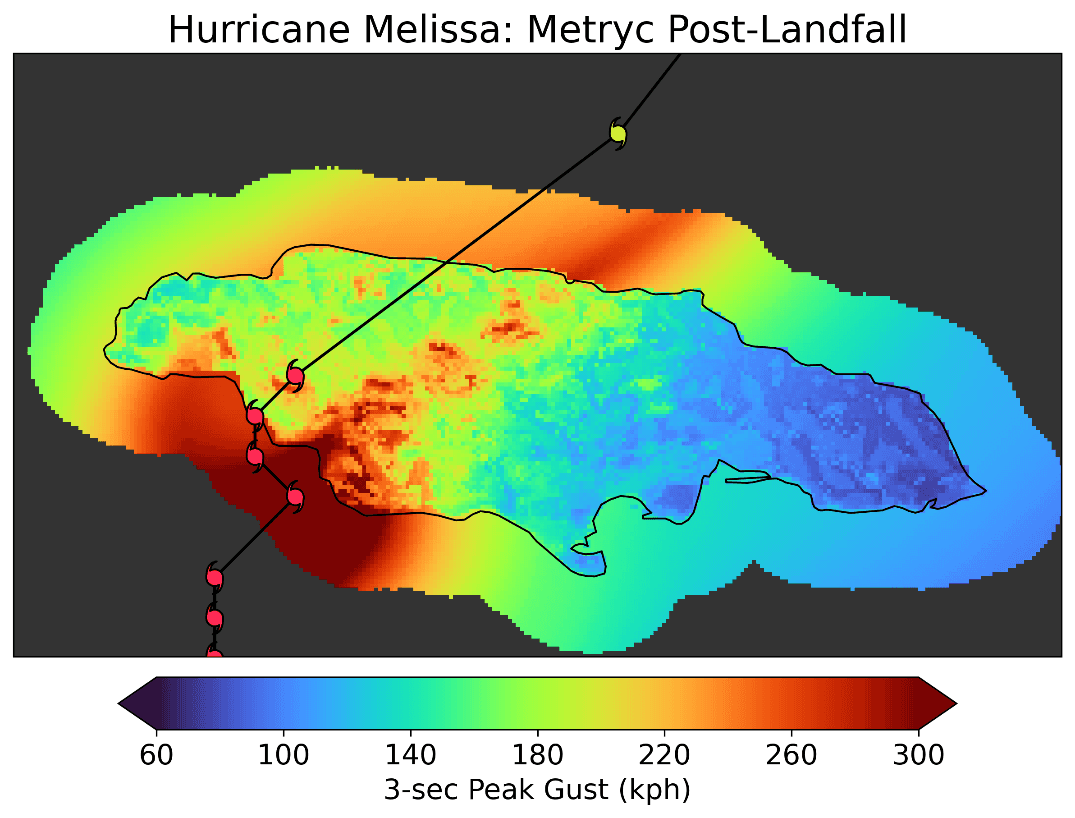
Figure 6: Metryc post-landfall wind footprint delivered within 48 hours of landfall, incorporating hourly NHC advisories and aircraft reconnaissance data. The track (black line with colored dots) now includes hourly positions, capturing short-duration peak intensities and track oscillations that resulted in 5-10 kph higher peak estimates compared to the interim product.
The color-coded swath clearly illustrates the dramatic spatial variation in wind impacts, from devastating winds exceeding 250 kph in the core landfall zone to rapid decay on the leeward sides of mountains. The track shown (black line with colored dots) now includes the hourly advisory positions, revealing short-duration peak intensities and track shifts as Melissa’s core approached the coast: these maxima fell between the 6-hourly snapshots used in the Interim product.
The differences between Metryc interim and post-landfall illustrate the value of enhanced temporal resolution. The hourly data showed that Melissa’s peak intensity occurred during a specific window as the core made landfall, resulting in modestly higher peak gust estimates (approximately 5-10 kph) in the most severely impacted coastal areas in the post-landfall reconstruction.
Parametric insurance is becoming increasingly important in Caribbean markets, where traditional insurance often involves slow and complex loss-adjustment processes, leaving policyholders waiting weeks or months for funds to arrive. This delay can be critical, as the immediate post-disaster phase is when financial support is most urgently needed to enable relief efforts and kickstart recovery. Parametric insurance directly addresses this gap: by relying on objective post-landfall wind speed estimates, such as those provided by Metryc, it enables rapid payouts within days rather than months. Hurricane Melissa demonstrates this effectiveness in practice: CCRIF has already confirmed a payout of US $70.8 million, and the IBRD Cat Bond is very likely to trigger a full payout of US $150 million, delivering critical funds to Jamaica while traditional claims are still being assessed.
Value for Decision-Making
The Melissa forecast sequence demonstrates several key operational capabilities that LiveCyc and Metryc bring to hurricane risk management:
Progressive refinement with calibrated uncertainty: As atmospheric predictability naturally improved at shorter lead times, the ensemble appropriately narrowed while maintaining realistic probability estimates. Unlike deterministic forecasts that can give false confidence, LiveCyc’s probabilistic approach honestly communicated what was knowable at each forecast horizon: from 2-8% probabilities at day -3, expanding to 16-17% at day -2, and finally reaching up to 25% at day -1.
Maintained scenario diversity: Even at day -1, when confidence was highest, the system preserved lower-probability but physically plausible scenarios. This allows risk managers to consider tail risks and plan for “what if” situations, not just the most likely outcome.
Actionable local-scale guidance: The transition from probabilistic track forecasts to 1-kilometer resolution wind footprints provided users with a complete view of hazard evolution, from initial awareness days before landfall through detailed post-event impact assessment at the neighborhood scale. The high spatial resolution captured critical terrain effects that produce up to 2 fold variations in wind exposure over distances of just a few kilometers
Real-time operational readiness: All forecasts were generated and delivered to users as Melissa evolved, with the full 1000-member ensemble computed within operational time constraints. This demonstrates the system’s capability for true operational decision support, not just retrospective analysis.
Beyond Hurricane Melissa
For organizations managing hurricane risk, this evolution from uncertainty to confidence over the critical 72 hours before landfall is exactly what’s needed for multi-stage decision frameworks. Lower-cost protective actions can be triggered earlier based on lower probability thresholds, while more expensive commitments can wait for the higher confidence that emerges at shorter lead times.
Hurricane Melissa tested LiveCyc’s capabilities in a real operational setting with a challenging late-season Caribbean track, complex terrain interaction, and rapid intensity changes. The system delivered evolving probabilistic guidance followed by rapid high-resolution wind field reconstruction, capturing both what we know and what remains uncertain as a dangerous storm approaches and impacts vulnerable regions.
For more information about LiveCyc and Metryc and how probabilistic tropical cyclone forecasts combined with rapid post-event wind field reconstruction can enhance hurricane risk assessment, contact the Reask team.


