The newsletter for climate-aware risk professionals.
The climate producing today's storms is not the climate that produced the historical record. Join 400+ risk professionals receiving the latest insights from Reask direct to their inbox.

Insights
From hurricanes to major hurricanes: What 45 years of satellite data really tells us about a warming climate
Observed data show more hurricanes intensifying into major hurricanes, but the record alone is short. UTC physics-based modelling confirms the trend is a real climate signal.

Nicolas Bruneau
|
Co-Founder, Reask

Thomas Loridan
|
Chief Science Officer, Reask

Jamie Rodney
|
CEO, Reask

Over the past 45 years, something has changed in the Atlantic basin. Hurricanes that form over warm tropical waters seem increasingly likely to intensify into major hurricanes: those Category 3 and above monsters that cause the most catastrophic damage.
However, proving this trend from historical records alone is surprisingly difficult. That's where physics-based climate modelling becomes essential.
The historical record: A hint, not a verdict
Looking at observed tropical cyclone data from 1980 to 2025, we can calculate a "conversion rate": the percentage of hurricanes (Cat1+ on Saffir-Simpson scale) that eventually reach major hurricane status (Cat3+).
The trend appears on the up: in the 1980s, roughly 3 out of every 10 hurricanes became major hurricanes.
Today, that rate is climbing to nearly 5 out of 10, with the 2025 season registering 4 Major hurricanes out of 5 Hurricanes (a record 80%); 3 of these 4 reaching Cat5 level.
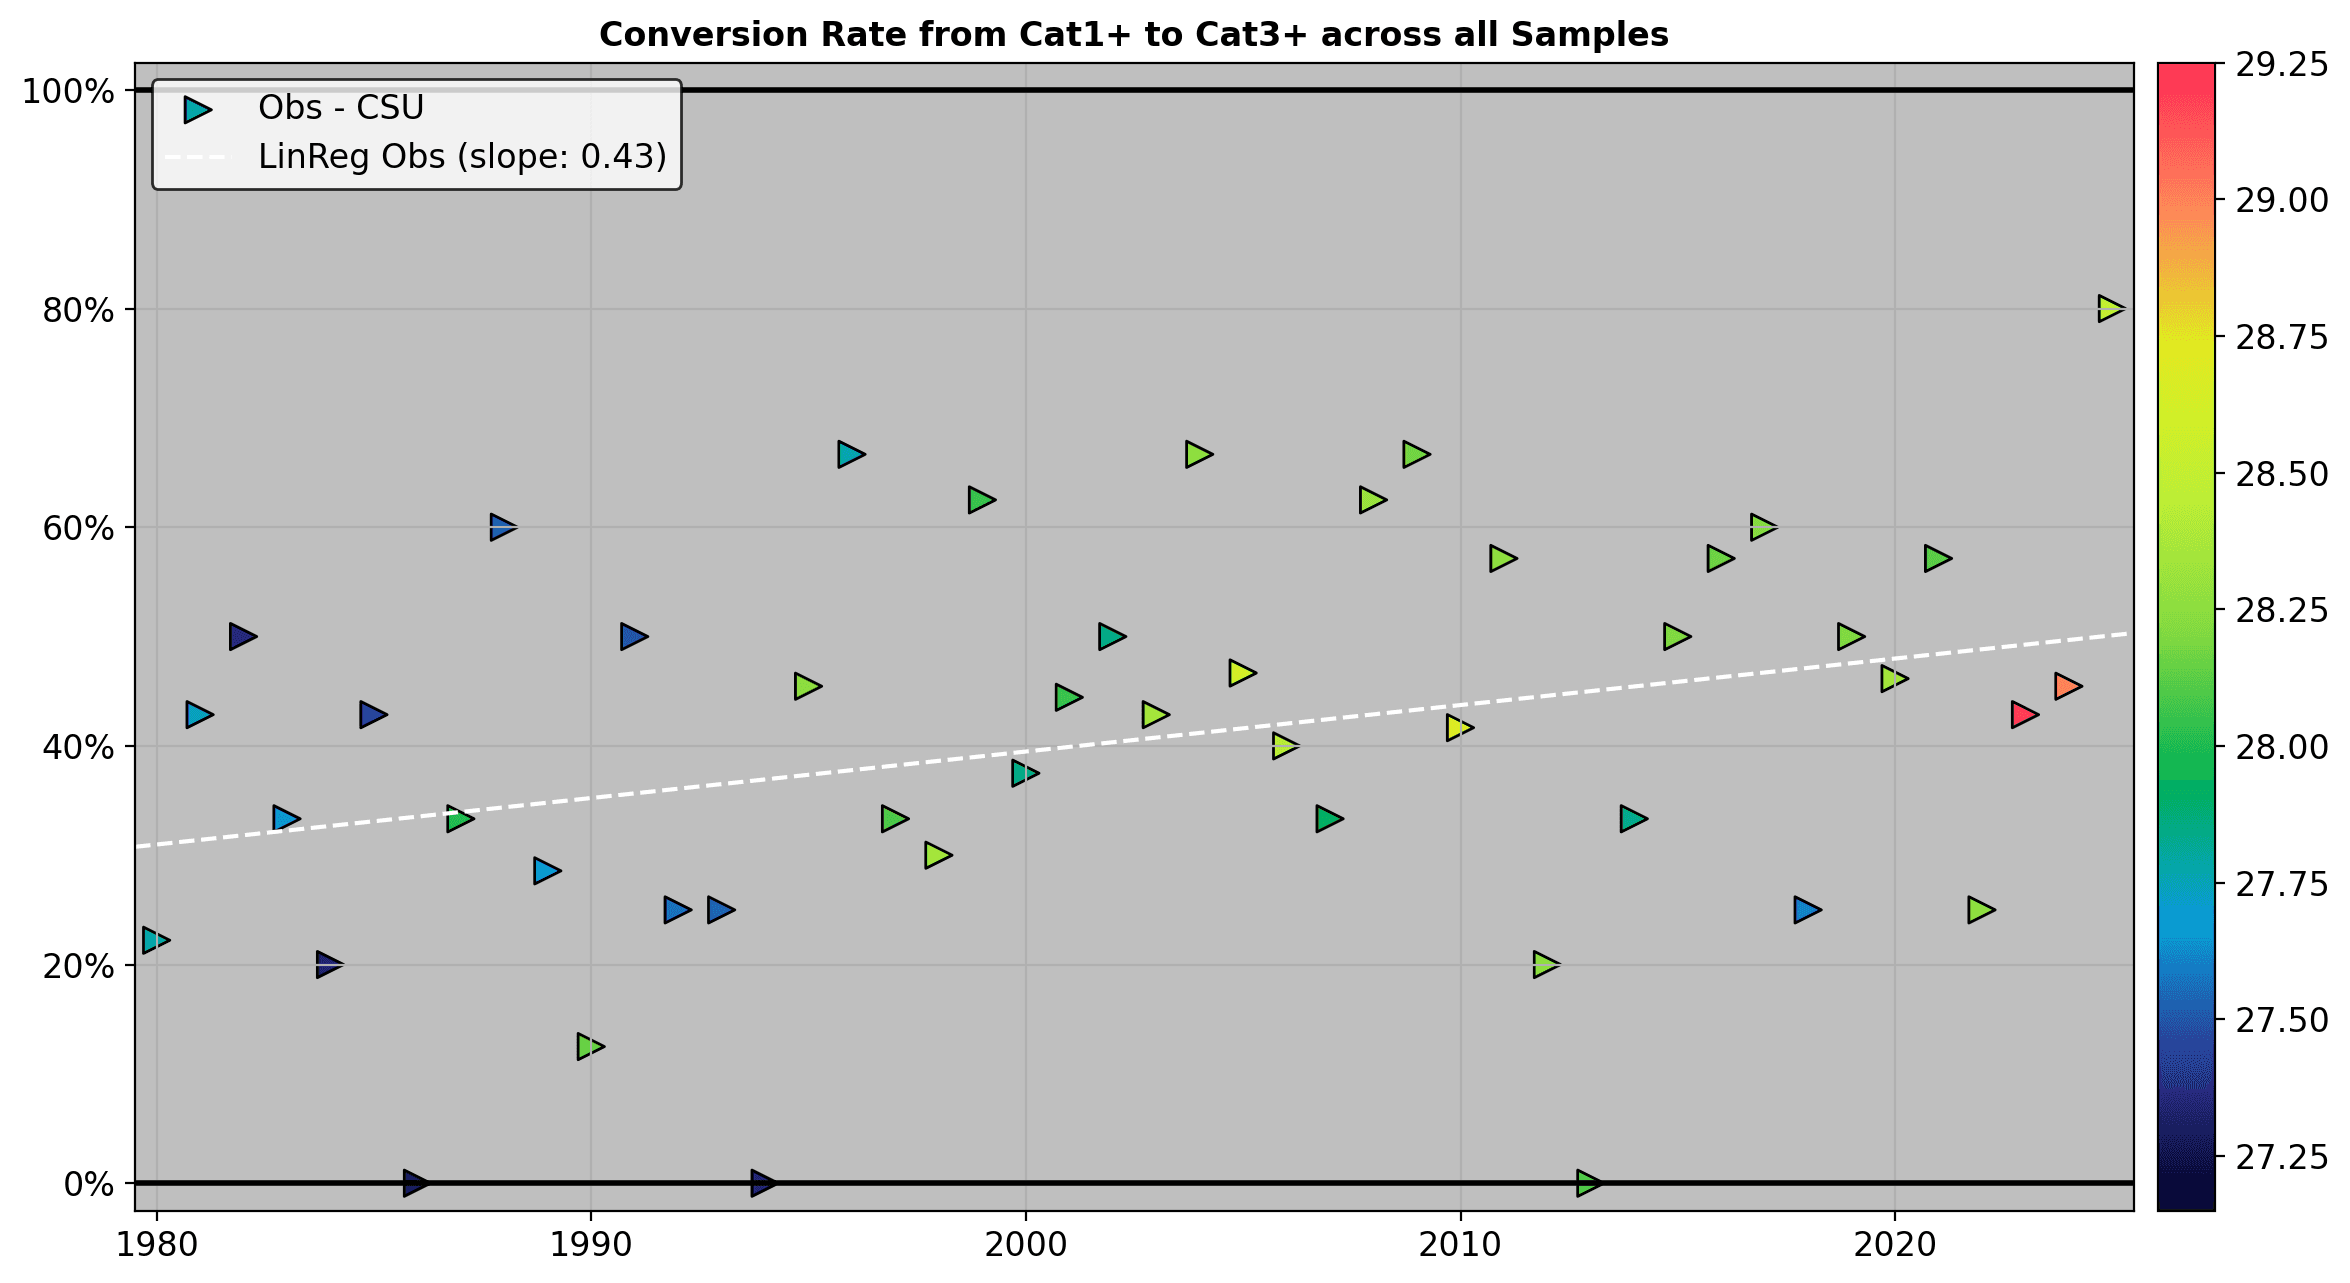
Figure 1: Observed records showing the conversion rate from Cat1+ to Cat3+ over time, with MDR SST indicated by colour (SST from ECMWF-ERA5 data¹).
If you plot a linear regression through these 46 data points, you get a slope of 0.43: a clear upward trend that seems to tell a compelling story.
Ocean temperatures in the Main Development Region (MDR) have warmed over this period (shown by the colour gradient from cool blues in the 1980s to warm reds in the 2020s), and basic physics tells us warmer waters provide more energy for storm intensification.
But here's the problem: 46 years is actually a very short sample when it comes to tropical cyclones.
Climate scientists deal with this challenge constantly: natural variability is enormous, and distinguishing a true climate signal from random fluctuations requires either very long records or a deep understanding of the underlying physical processes at work.
Critics might ask: Could this just be luck? A statistical artifact? Maybe the 1980s were unusually quiet and the 2020s unusually active by chance alone?
Without understanding why this trend exists, we're stuck waiting decades more for additional data to strengthen our confidence. But when it comes to climate adaptation and risk management, we don't have that luxury.
Testing the physics: 2,500 replays of the history
This is where the Unified Tropical Cyclone (UTC) framework offers a powerful solution. Instead of relying solely on what actually happened, we can use physics-based modelling to explore what could have happened under the same climate conditions.
The UTC is built differently from traditional statistical hurricane models. Rather than simply extrapolating from historical patterns, it explicitly connects tropical cyclone behaviours to fundamental climate physics: sea surface temperatures, wind shear, atmospheric pressure, and steering flows.
When you feed it the climate conditions from any year, say, the SST patterns and atmospheric setup of 1999, it doesn't just spit out a single deterministic answer.
It generates many possible hurricane seasons that could have occurred under those climate conditions, capturing the inherent randomness of where and when storms form and how they evolve.
We ran the UTC model 2,500 times over the 1980-2024 period, using the actual reanalysed climate conditions (including SST) as inputs. Each run represents an equally plausible alternative history: i.e. a different roll of the meteorological dice.
Figure 2: Selection of individual sample spanning the 1980-2024 period showing varying trends in conversion rates, from slopes of -0.2 to +1.2].
The results are fascinating. Individual runs show wildly different trends. Some samples show conversion rate increases even steeper than observed (slopes up to 1.3). Others show essentially no trend (slopes near 0.0) or even slight decreases (slopes as low as -0.5).
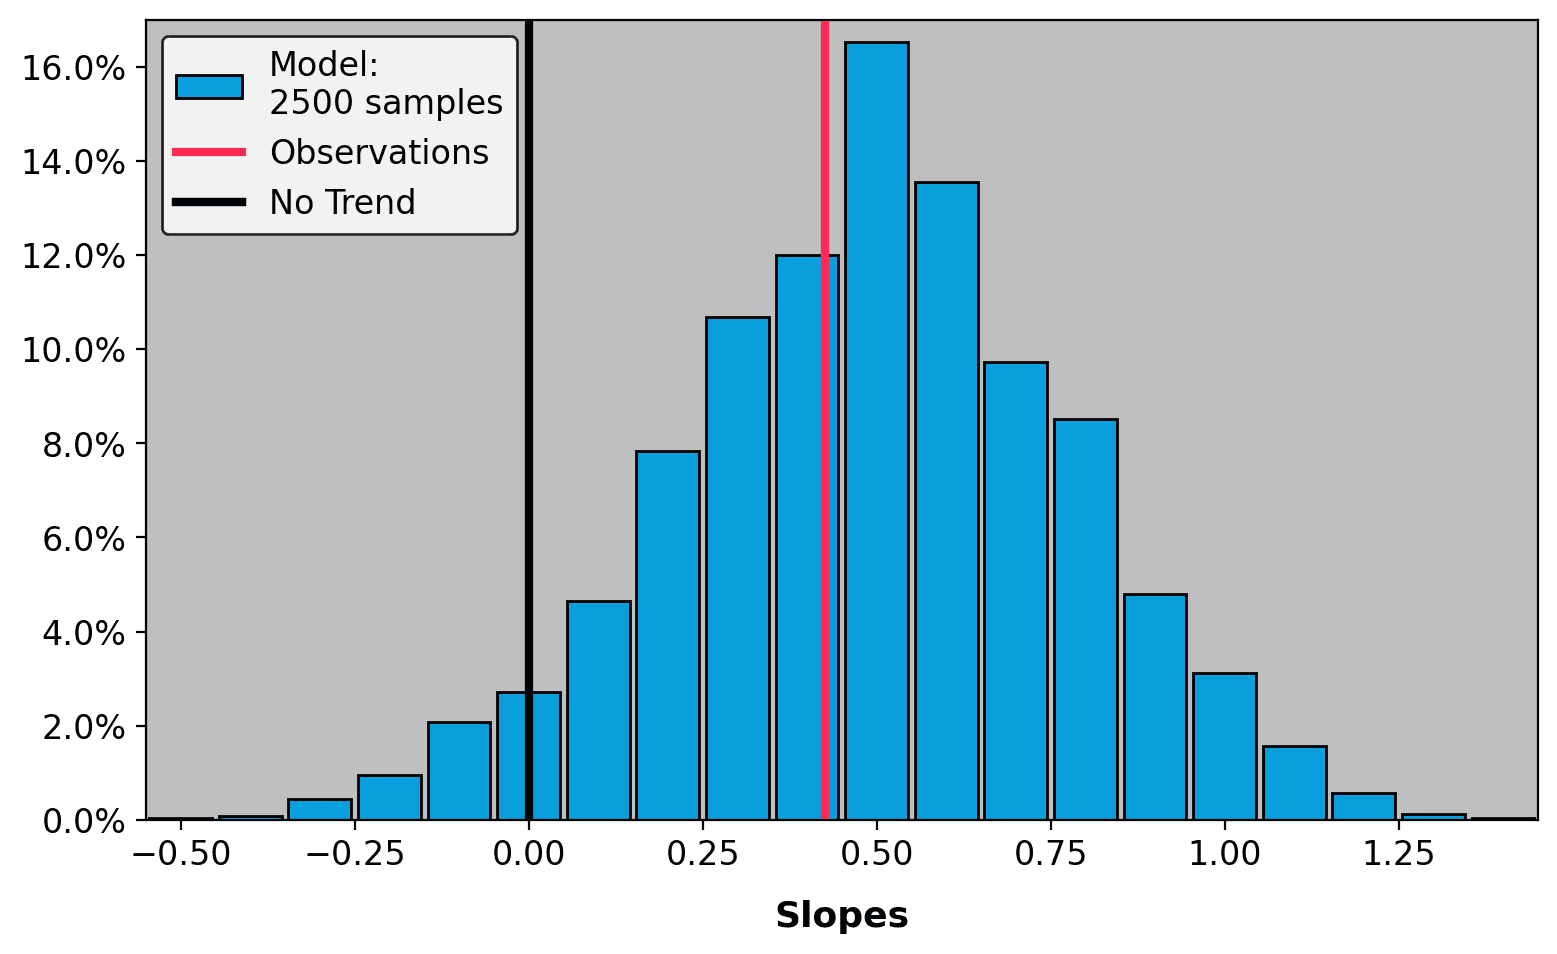
Figure 3: Distribution of the 2500 trends calculated with the UTC model superimposed with the observed trend.
This variability is not a weakness, it's a strength. It demonstrates that the model captures the natural stochasticity inherent to tropical cyclone activity.
In some alternative histories, random chance could have masked the underlying climate signal. In others, it could have amplified it. Our experienced history - the real world - gave us just one of these possible paths.
The ensemble mean: The signal emerges
Now comes the crucial step. When we average across all 2,500 simulations, the noise of individual weather events cancels out, and the underlying climate signal emerges clearly.
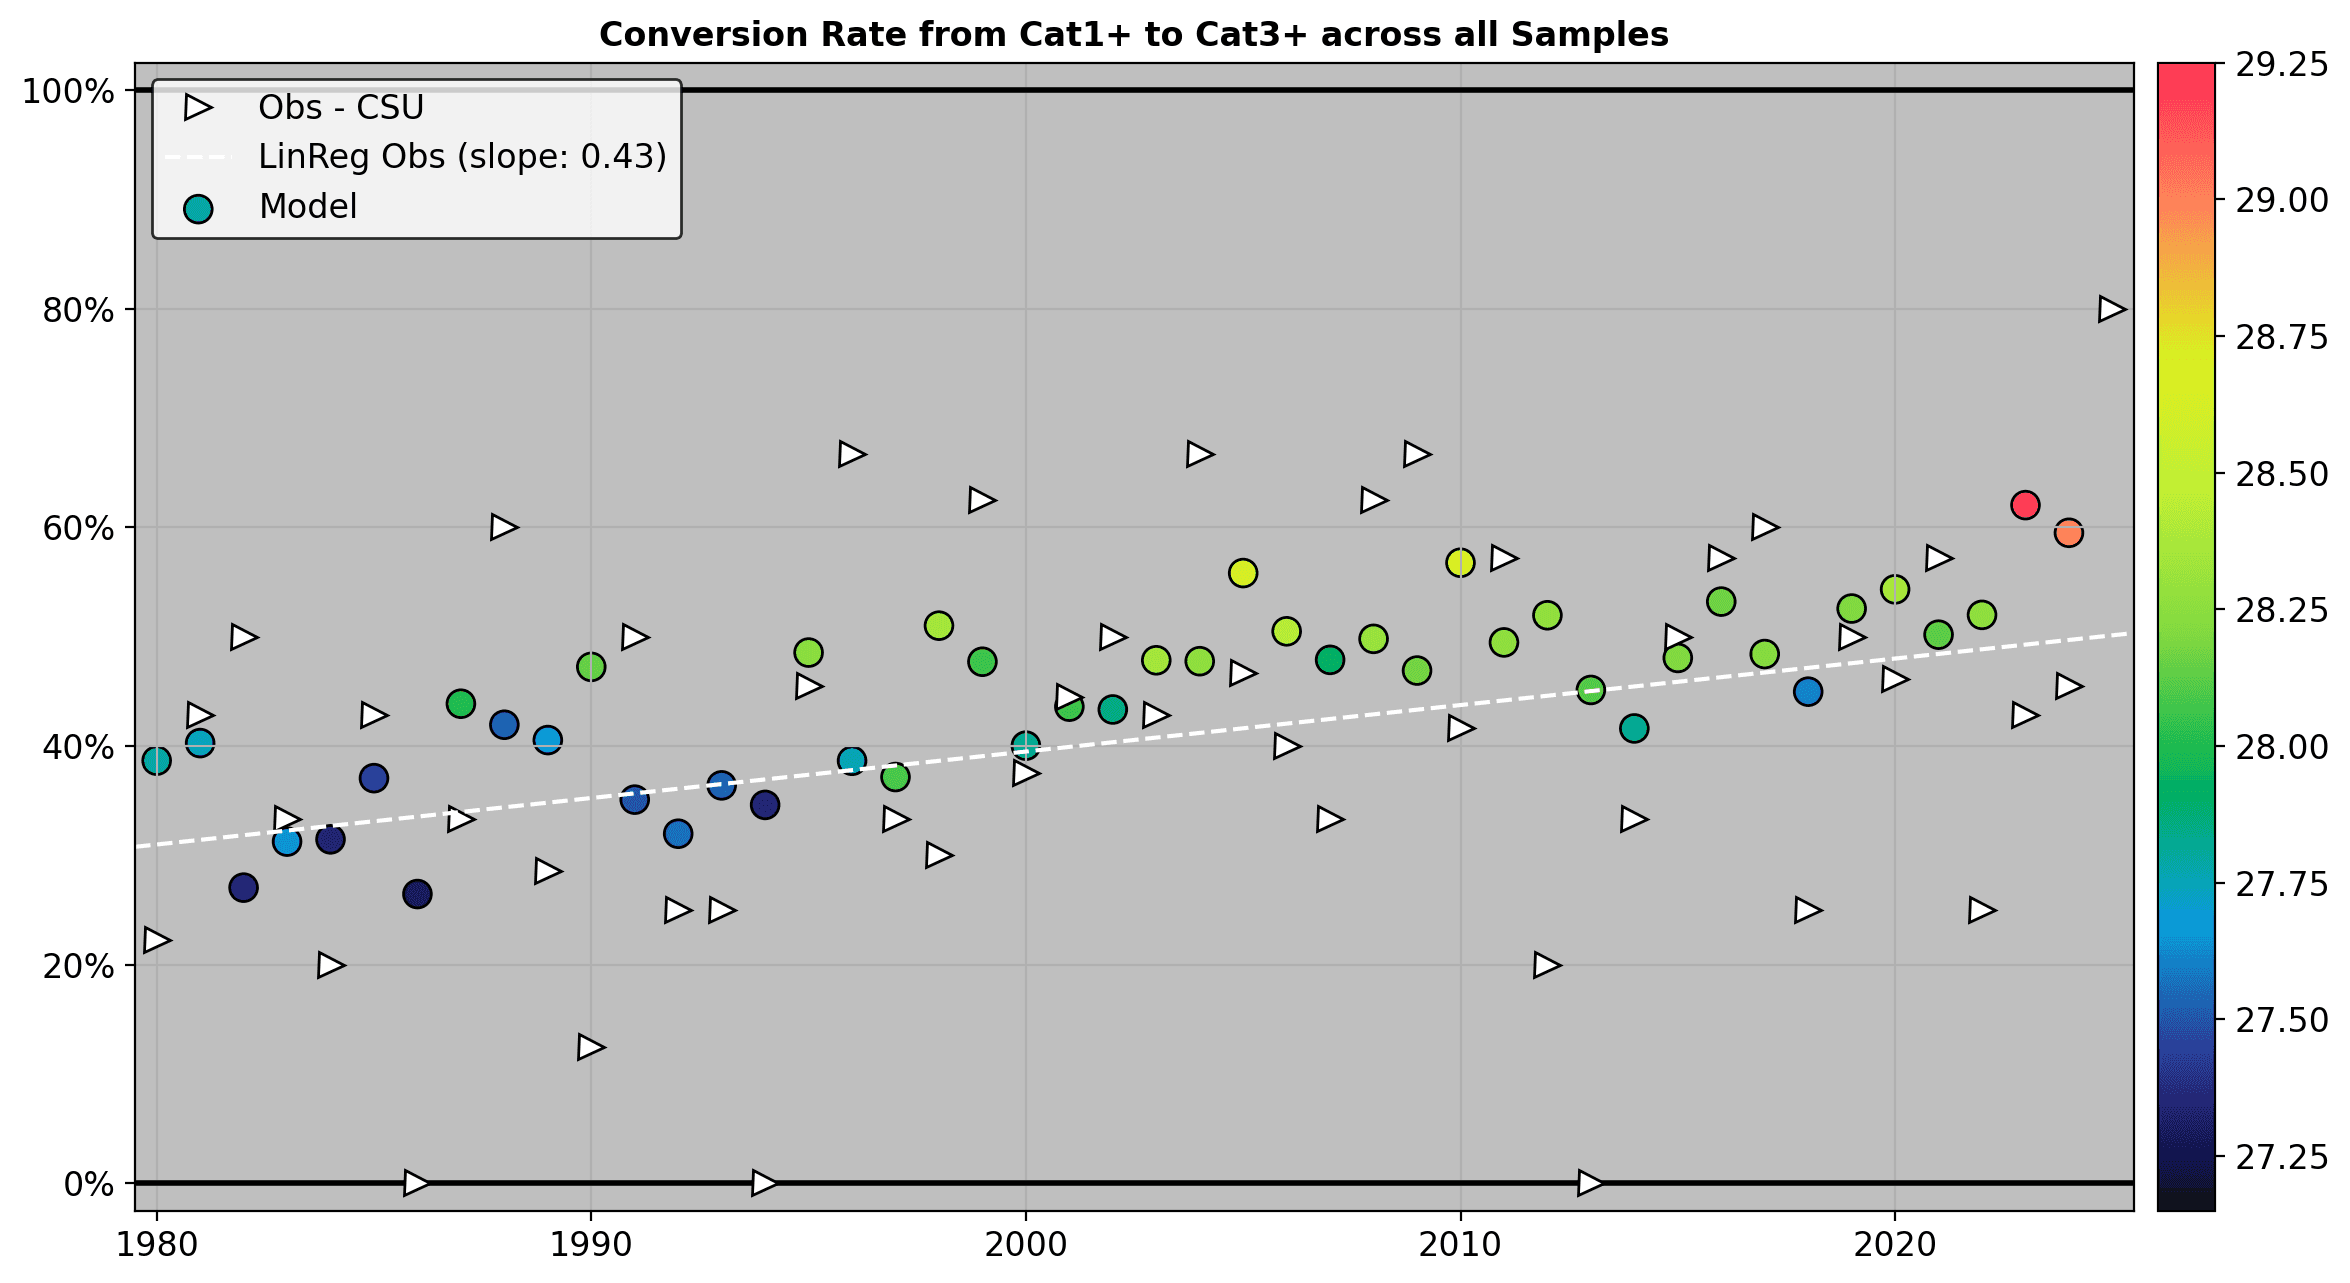
Figure 4: Model mean from all 2,500 samples, showing ensemble average conversion rate with slope of about 0.50.
The ensemble mean shows a conversion rate trend with a slope of 0.50, actually slightly stronger than the observed 0.43. More importantly, we can see the year-by-year progression closely tracking the observed warming in Atlantic SSTs.
The dashed line connecting the model's year-by-year averages smooths through the individual-year variability, revealing the physics-based expectation: as the Atlantic warms, we should indeed expect hurricanes to more frequently intensify into major hurricanes.
The model's verdict is clear: the trend we observe in the historical record isn't just statistical noise or bad luck. It's a physically-grounded response to a warming ocean.
Why this matters for climate risk
This analysis demonstrates something critically important for climate risk assessment: we don't need to wait another 50 years to understand how tropical cyclone risk is changing.
By anchoring our models in fundamental physics rather than pure statistics, we can:
Validate trends in current observations with confidence, distinguishing real climate signals from natural variability
Quantify uncertainty by examining the full range of possible outcomes under given climate conditions
Project future risk by running the same physics-based model under projected future climate states
The UTC framework excels at all three. It tells us that the increase in major hurricane frequency isn't just something we're observing, it's something we should expect as a physical consequence of ocean warming.
And critically, it gives us a reliable tool to assess how that risk will continue to evolve as the Atlantic continues to warm in the decades ahead.
For coastal communities, insurers, and decision-makers planning infrastructure that will last 30-50 years, this distinction matters enormously. The historical record suggests change is happening. The physics tells us why, and what to expect next.
While understanding basin-wide intensification trends is essential, the decisive factor for risk assessment is understanding how these powerful storms behave at landfall. Our partners at OAK Global have examined this key relationship using Reask UTC data.
The Unified Tropical Cyclone (UTC) framework is detailed in Loridan & Bruneau (2025), "Reask UTC: a machine learning modeling framework to generate climate-connected tropical cyclone event sets globally," Natural Hazards and Earth System Sciences.
References
Hersbach et al., 2020. The ERA5 global reanalysis. Q. J. R. Meteorol. Soc. 146, 1999–2049
Loridan and Bruneau, 2025. Reask UTC: a machine learning modeling framework to generate climate-connected tropical cyclone event sets globally, Nat. Hazards Earth Syst. Sci., 25, 2863–2884, https://doi.org/10.5194/nhess-25-2863-2025


