The newsletter for climate-aware risk professionals.
The climate producing today's storms is not the climate that produced the historical record. Join 400+ risk professionals receiving the latest insights from Reask direct to their inbox.

Insights
Why process-based event simulations beat simpler risk models
Three approaches to climate risk modelling, from risk scores to event simulation, and why only one works across all use cases.

Thomas Loridan
|
Chief Science Officer, Reask

The climate risk modelling landscape has become very crowded, with some fundamentally different modelling techniques being used across a wide range of use cases. For most users, it is now very challenging to understand if models are appropriate for a specific use case, or if they are being applied outside of the scope they were designed for.
As is often the case with probabilistic forecasting, we can find useful analogies from the world of sports that help illustrate this challenge. Here we introduce 3 simple sport prediction scenarios, and discuss the modelling suitable for each. We then relate the three use cases and associated modelling techniques to climate risk forecasting, and group models into three fundamentally different buckets.
Three flavours of sports predictions
Scenario 1: You just arrived in a foreign country and you are asked by your new colleagues to make a prediction on the last round of games for a local sport you’ve never heard about. It’s an important office tradition so you have to get involved but you don’t have much time, and clearly very little expertise. You just want to comply with the request and get on with your life.
Scenario 2: You work for a media company and you are tasked with providing winning percentages to display ahead of major televised games. The numbers need to reflect many of the subtleties of the game context but no money will be made or lost based on their accuracy. You are keen to dive into the key factors that help winning and be recognized as knowledgeable in the field, but you do not need to be the best.
Scenario 3: You are a professional sports gambler. Your livelihood depends on the accuracy of your predictions, and your ability to beat the markets on a range of outcomes beyond winning probabilities. You do not only need to be an expert but thrive to be the best in a very competitive field. Any edge you can get matters to you.
Now, the question is: what type of model should you use in each case, and what has this got to do with climate risk?
Relative risk rating
In scenario 1, it is ok to take a broad-brush approach, and there is no real need for accurate predictions or quantification of uncertainty. Just pick the winners and losers. You can keep it basic, look at the league table and pick the better ranked team for every game. That won’t win the office tournament but that will get you involved without being ridiculous.
This is a relative rating approach, equivalent to using risk scores for your climate risk assessment. It is sufficient for (some) regulatory exercises, and typically the first step towards understanding your risk. It is useful for relative risk screening, when identifying the riskiest sections of your portfolio, but not much else.
Context-based probabilistic modelling
In Scenario 2 the requirements are higher. You now need to provide at least one clear probabilistic metric of risk: the winning probability for each team. You will be judge on how realistic these estimates feel, and if the numbers don’t feel right to your audience, you are likely to lose your job. Here you need a model that understands the context of the games (home, away, key players missing etc…) and that can be easily explained within this context.
In climate risk, this type of probabilistic modelling can be achieved through methods rooted in physics (climate model downscaling being one of them). If done properly, this allows quantification of local risk distributions (probabilities) from knowledge of key climate conditions or asset attributes (the context). With such metrics and context, you can start to quantify how certain scenarios might shift your risk. This opens the door to more sophisticated use cases such as mitigation or risk hedging.
Process-based event simulations
Finally, in Scenario 3 you can’t cut any corners. You will make or lose money based on the accuracy of the predictions, and you need a thorough process in place to predict a whole range of outcomes systematically. You are not looking only at one metric (match winning probabilities), but also at a wide range of other events linked to that metric (likelihood of a team winning the first half, scoring more than X, seeing a player red carded etc…). Importantly you want all these events to be modelled under a consistent, correlated framework (they are not independent outcomes).
Forecasting these events is best achieved with a process-driven modelling approach, one where each game is explicitly simulated millions of times with records of all in-game outcomes. From these simulations, the likelihood of all outcomes can be quantified and explained.
This type of event-based, process-driven modelling is common in the insurance industry (e.g. stochastic event sets) and is increasingly used in the banking space too. For these industries, having better predictive modelling capabilities offers a clear competitive edge, and the health of these business relies on accurate risk quantification.
The need to quantify risk correlation across a portfolio also means individual locations can’t be treated independently and a process-driven, event-based modelling approach addresses this better than downscaling of climate models.
Finally, event-based modelling also allows quantification of the likelihood of very specific scenarios (see example below) – the types used to comply with the more stringent regulatory requirements around stress testing probable worst events.
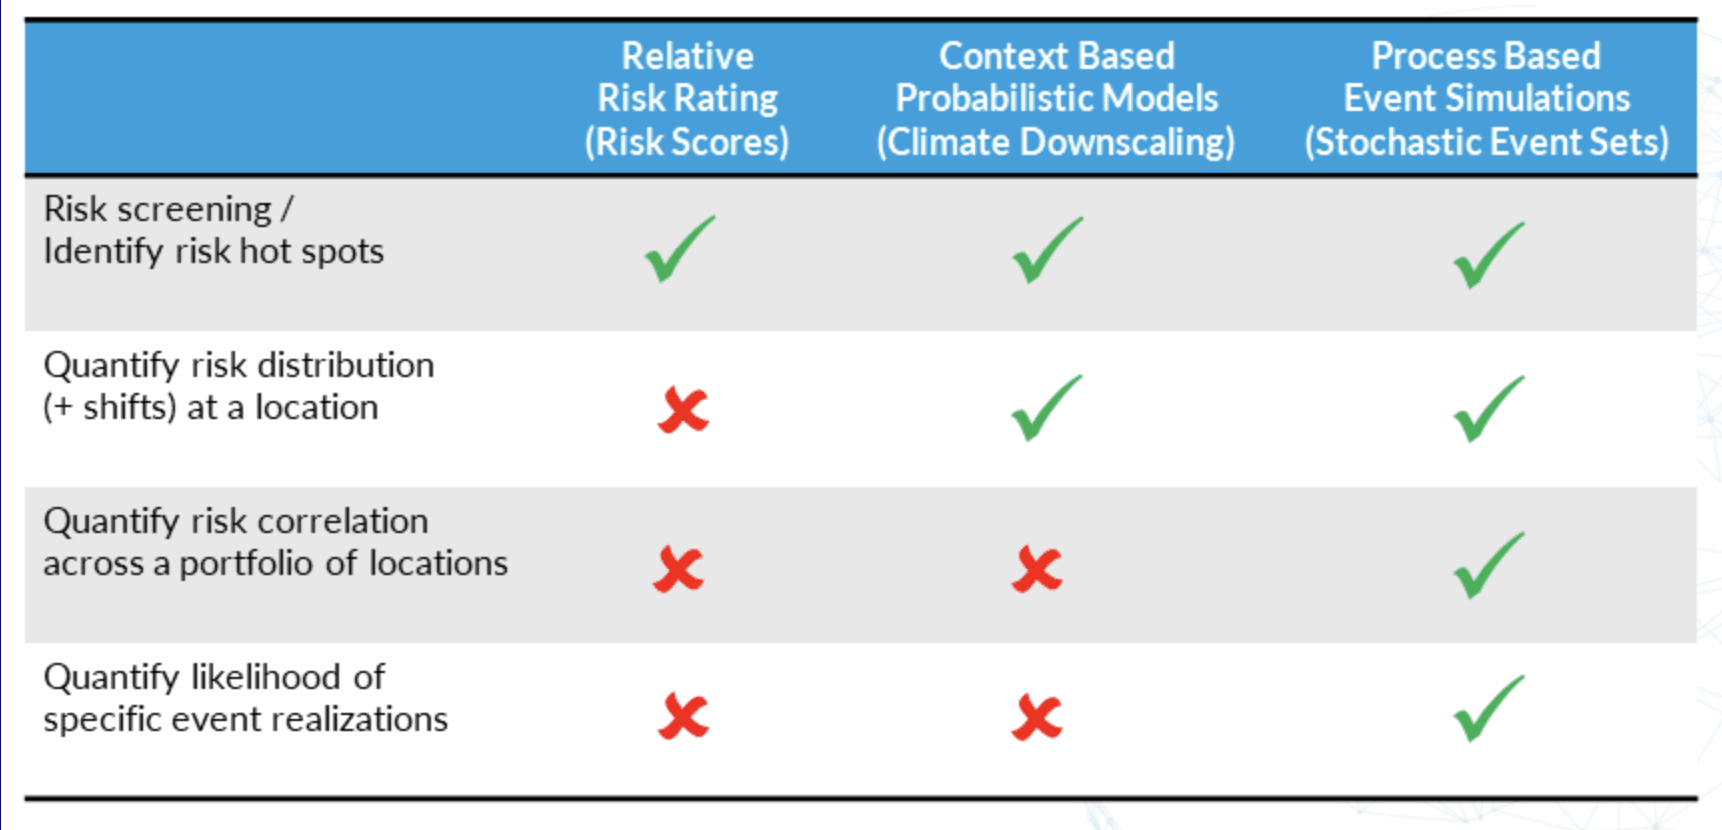
Out of the 3 families of models mentioned above, only the third one can be applied across all scenarios. While they are more demanding to run, process-based event simulations allow for a much deeper quantification of risk. Going from that depth to simpler use cases like scenario 2 and 1 above then becomes a simple post processing task.
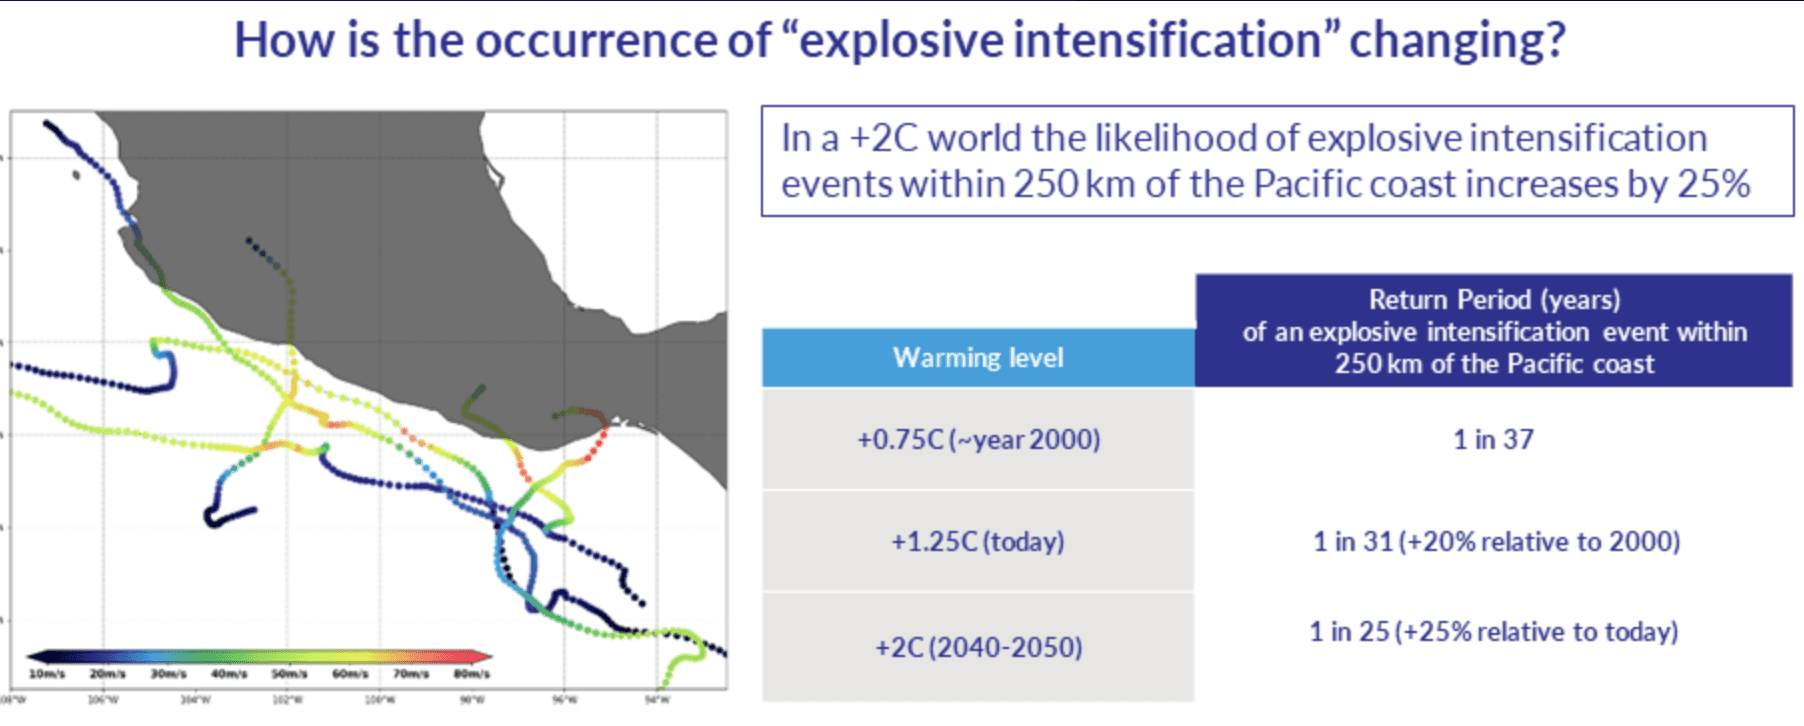
At Reask everything we do is event based and our simulations are driven by physics. As a result our models are designed to satisfy the requirements of all 3 scenarios above, and excel are dealing with scenario 3. Because we simulate millions of physically realistic events under changing climate conditions, we can answer your more specific questions. As an example the graphic below shows how our models quantify the likelihood of explosive intensification near the Pacific coast under a range of climate warming levels.