The newsletter for climate-aware risk professionals.
The climate producing today's storms is not the climate that produced the historical record. Join 400+ risk professionals receiving the latest insights from Reask direct to their inbox.

Case studies
MS Amlin: What does a 2°C warmer climate mean for US hurricane losses?
MS Amlin used Reask's climate-conditioned event sets to model how US hurricane losses shift under 2°C of warming, in a study published in the Journal of Catastrophe Risk and Resilience.

How specialty (re)insurer MS Amlin used Reask’s climate-conditioned event sets to quantify the impact of warming on their US hurricane portfolio and published the results in a peer-reviewed journal.
Client | MS Amlin |
|---|---|
Sector | Specialty (re)insurance |
Reask solution | DeepCyc: Climate-conditioned event sets |
Use case | Long-term climate scenario analysis |
Published in | Journal of Catastrophe Risk and Resilience (June 2025) |
Geography | US hurricane exposure |
The challenge
MS Amlin wanted to understand how continued climate warming would affect hurricane losses across their US portfolio. To do this credibly and defensibly, results need to reflect insured impact.
Cat models are typically calibrated to decades of historical hurricane data. They assume that the conditions that produced history remain in play today. But history does not tell you what a 2°C warmer climate means for probable maximum loss, or where along the US coastline risk is shifting fastest.
And when questions arise about whether to trust the model, "it’s based on history" is a difficult position to hold when the climate producing today's storms is not the climate that produced the historical record. This is particularly acute in the tail, where the impacts are largest and the historical data is thinnest.
Workarounds rarely solve this either. Regulatory stress tests like the Bank of England's CBES used emission pathways and fixed time horizons that didn't reflect how an annually renewing reinsurance portfolio is exposed. As Pope and Phibbs noted in their paper, those scenarios were often "overly generalised."
Published climate science often focuses on basin-wide activity rather than landfalls and translating those findings into model adjustments requires regional granularity that emerges in a credible way from the physics.
Users need a defensible scenario framework that is thermodynamics-based, regionally granular, and plugs directly into existing modelling workflows.
The approach
Ed Pope and Sam Phibbs at MS Amlin used Reask's DeepCyc to build a 2°C warming scenario for their US hurricane portfolio.
Rather than counting past storms and projecting forward, DeepCyc models the conditions that produce them: current ocean temperatures, atmospheric patterns, and climate drivers. It then generates millions of synthetic tropical cyclone events that reflect what is physically possible under those conditions.
This is what makes climate-based risk adjustment different from legacy approaches: the model is conditioned on the physics of now, not the statistics of then.
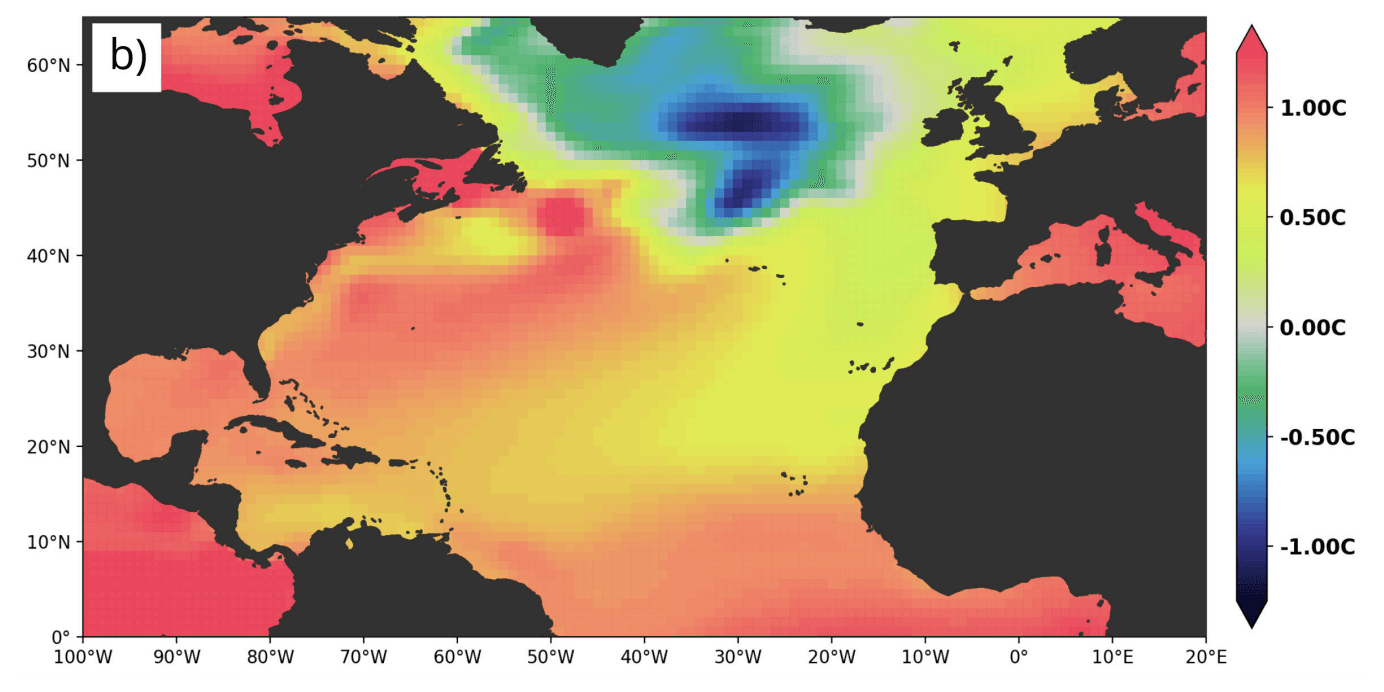
Sea surface temperature anomalies under the 2°C scenario. Warmer water extending poleward along the US east coast allows hurricanes to maintain intensity to higher latitudes. Source: Pope & Phibbs (2025), Figure 3b.
Because DeepCyc generates stochastic events tied to defined climate states, the MS Amlin team could isolate the effect of warming on storm frequency, intensity, and track behaviour across 12 separate US coastal regions, from Texas to the Northeast.
Reask provided regional rates of change in landfall frequency under a 2°C above pre-industrial climate (compared against a 1.1°C present-day baseline), broken down by tropical cyclone intensity category, granularity that published climate literature and regulatory stress tests hadn't offered.
The MS Amlin team then applied these rate changes to their existing 100,000-year simulated event set, following an established methodology (Jewson, 2023a). Events were categorised by region and maximum landfall intensity, additional landfalls were sampled based on Reask's adjustment factors, and the process was repeated to test for convergence.
They ran the analysis twice, once with a US-wide adjustment and once with the full regional segmentation, to show how much resolution matters when the question is “where risk is moving?”, not just whether it's increasing.
The approach worked with MS Amlin's existing modelling infrastructure. No new platform. No multi-year integration project. Reask's climate-conditioned data layered directly onto the event set they were already using.
The result
The study, published in the Journal of Catastrophe Risk and Resilience in June 2025, demonstrated that climate-conditioned event sets produce materially different loss distributions compared to historically calibrated models, particularly in the tail, where capital adequacy decisions are made:
US-wide average annual losses increase by approximately 39–42% under a 2°C scenario, with the 1-in-200 aggregate exceedance probability loss rising by 25–26%.
The eastern seaboard sees the greatest relative change. Rhode Island and Massachusetts each see a 71% increase in AAL. New York sees 64%. Florida increases by 44%. For the Carolinas, loss increases at short return periods are roughly double those for the contiguous US and more than double those for Texas.
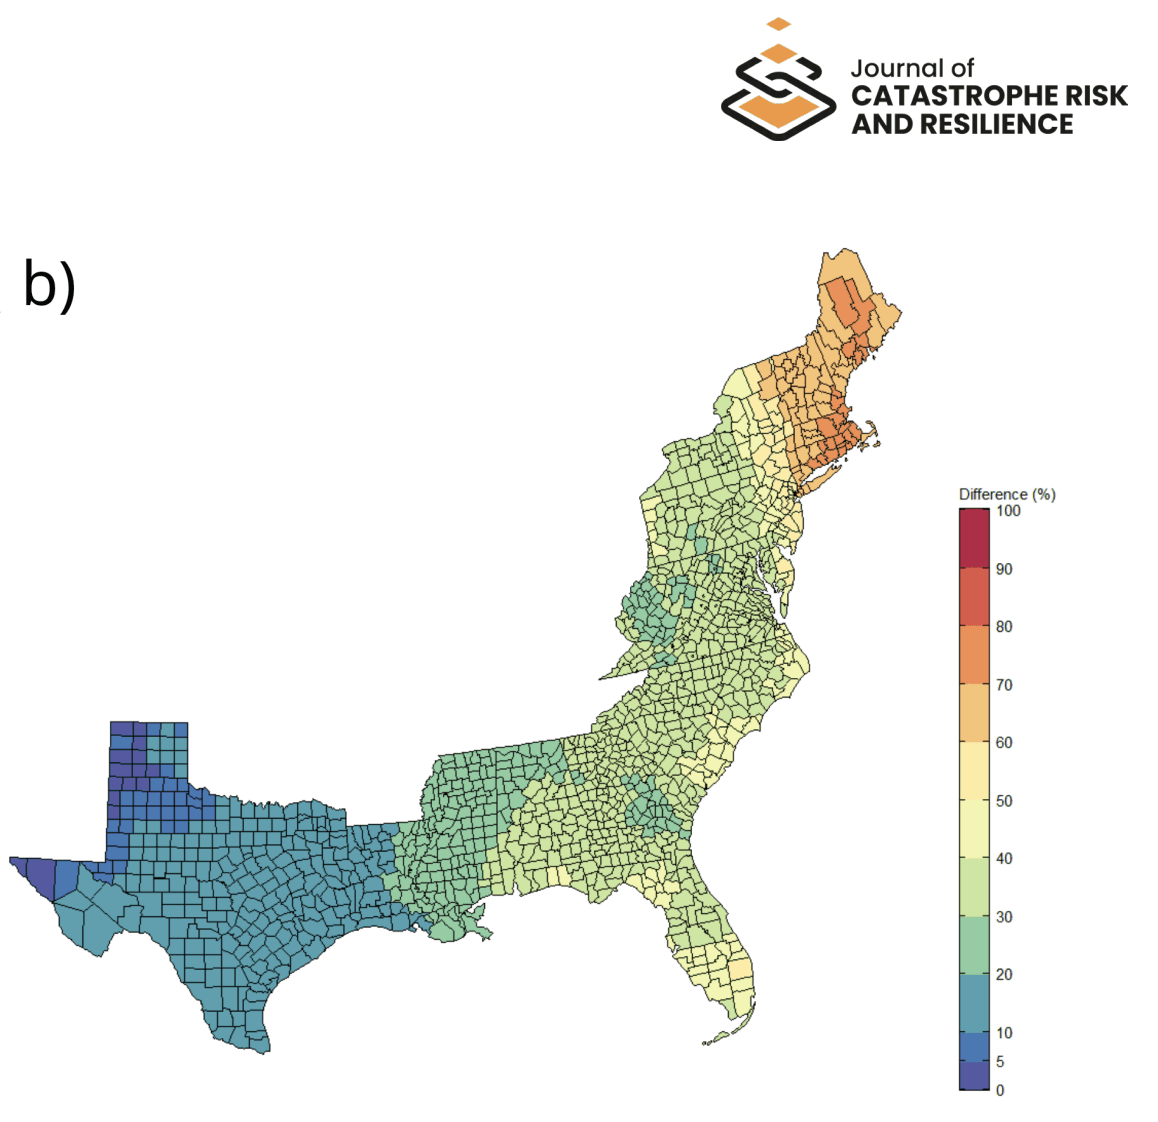
Change in average annual loss under a 2°C warming scenario using regional landfall adjustments. Source: Pope & Phibbs (2025), Figure 5b.
Years without a US landfall drop by 30%, meaning exposure to clustering and high-landfall seasons increases significantly.
Regional adjustments reveal what national averages hide: regional carriers could face very different loss outcomes than national carriers or reinsurers, a finding only visible through climate-conditioned, physics-based analysis.
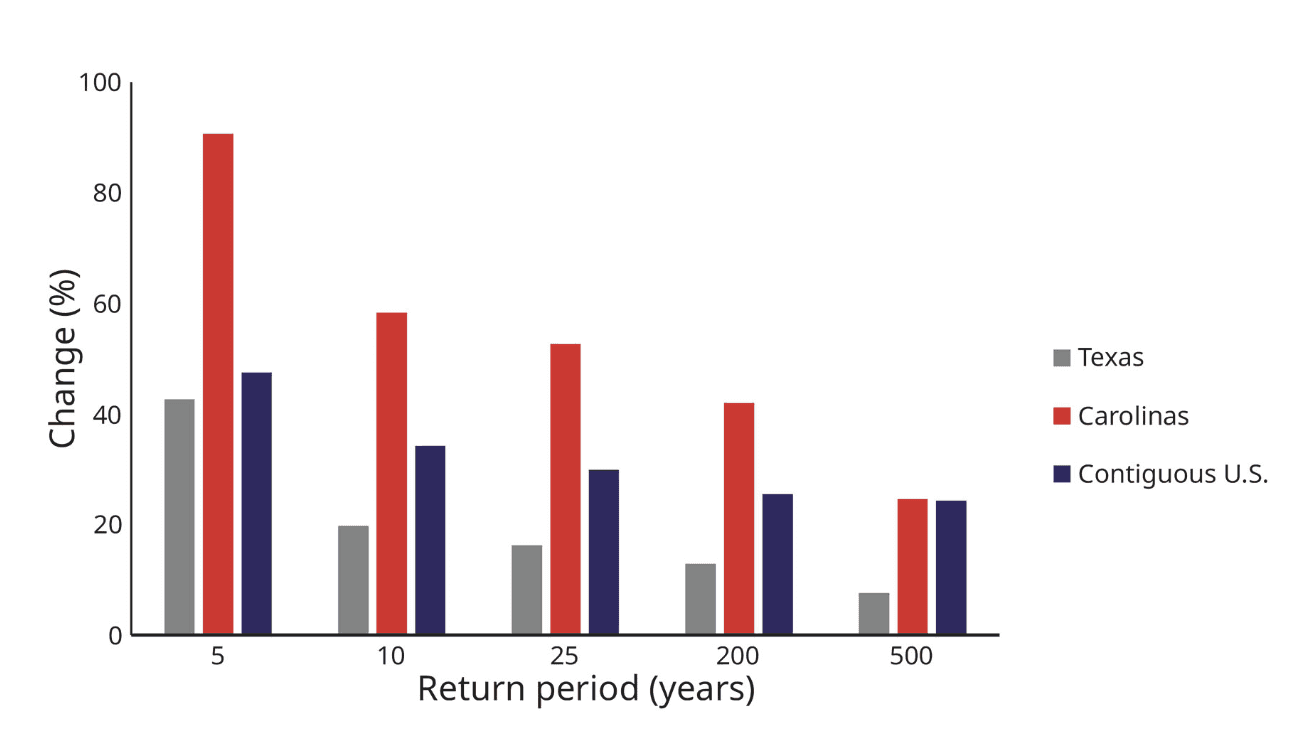
Change in AEP insured losses under a 2°C warming scenario for Texas, the Carolinas, and the contiguous US. Source: Pope & Phibbs (2025), Figure 6.
The driver is physical. Under a 2°C climate, warmer sea surface temperatures extend poleward along the US east coast, allowing hurricanes to maintain intensity to higher latitudes. Regions where major landfalls have been historically rare face a materially different risk profile. The paper argues building codes applied in Gulf Coast states should extend to higher-latitude coastal communities.
This is one of the first peer-reviewed studies to use climate-conditioned catastrophe model output for portfolio-level loss analysis in a commercial (re)insurance context.
For a broader look at why observed hurricane data alone falls short, see our analysis of US hurricane landfall trends.
In their words
Published climate literature gave us basin-wide projections, but we needed regional landfall granularity we could feed directly into our event set. Reask's data let us isolate how warming shifts hurricane risk across 12 US coastal segments. That level of resolution simply wasn't available from other sources.
— Sam Phibbs, MS Amlin
Published source
Pope, E. L. & Phibbs, S. (2025). Insured U.S. Hurricane Loss Under a 2°C Warmer Climate. Journal of Catastrophe Risk and Resilience, Volume 03, Article 02. https://doi.org/10.63024/rsve-v5qa
Reask solution used
DeepCyc generates millions of synthetic tropical cyclone events conditioned on current and future climate states, from ENSO variability to 3°C+ warming scenarios. It captures the conditions of now using physics, not statistics, and can reproduce the historical record while revealing what it hides. Learn more about DeepCyc →
Explore how DeepCyc can give your portfolio a defensible, climate-conditioned view of risk. Speak to the team →


