The newsletter for climate-aware risk professionals.
The climate producing today's storms is not the climate that produced the historical record. Join 400+ risk professionals receiving the latest insights from Reask direct to their inbox.

Insights
From plausible to useful: hurricane science and risk decision making
A framework for evaluating which hurricane science is defensible enough to anchor risk decisions, and which is just plausible.

Jamie Rodney
|
CEO, Reask

Thomas Loridan
|
Chief Science Officer, Reask

Nicolas Bruneau
|
Co-Founder, Reask

Daniel Swain
|
PhD, Reask climate advisor

There are plenty of plausible scientific theories, but few end up having useful application for risk decisions.
It's three months before hurricane season. You sit down to review the science. You read that North Atlantic sea surface temperatures are running near record highs, that the fraction of storms reaching major intensity is rising, that 2025 produced three Category 5 hurricanes, only the second time in Atlantic history. The thermodynamic case for elevated risk is clear, empirically supported, and directionally consistent.
Then you read something else. An argument that warming upper tropospheric temperatures are increasing atmospheric stability, suppressing convection, and acting as a natural brake on hurricane development. Fewer storms, it suggests, or at least not meaningfully more. The physics, on its face, is coherent.
Someone asks you: which signal wins? You feel stuck. You know you can make the numbers go up or down in ways that feel like your own judgement call. A call that can be backed by some academic papers, but not all. More importantly, a call that could be challenged equally on both sides. Even if the science does not feel settled, your deadline is.
This is the real problem facing the market today. No shortage of scientific commentary and an excess of plausible-sounding arguments that feel like they point in all directions.
There is a large gap between a credible scientific explanation of what has happened in recent years (hindsight analysis) and an actionable risk modelling tool on which to anchor costly present and future decisions. Without a model that finds the signal rather than assumes it, you cannot price risk with confidence, construct portfolios defensibly, or explain your assumptions. The uncertainty feels academic. The consequences are not.
What 2025 showed
The 2025 Atlantic season was a high-fidelity demonstration of the physics now governing hurricane risk. Sea surface temperatures in the Main Development Region were the fifth warmest on record creating ample fuel. Yet the season was marked by extended periods of suppressed activity. Upper tropospheric warming outpaced the surface, reducing the vertical temperature differential and creating a stability lid that killed convection for weeks at a time. A below-average number of hurricanes formed.
But the storms that did organise crossed a threshold into self-sustaining, high-inertia systems that shielded their inner cores from the otherwise hostile environment. Once there, they tapped exceptionally high, and, in some cases, record-breaking ocean heat and reached Category 5 status. Humberto, Erin, and Melissa: three Cat 5s in a season with below-average total hurricane count.
This is the bifurcation made visible. Atmospheric stability acts as a high-pass filter killing the weaker “storm seeds” while allowing the most intense storms to grow into monsters. The result is not a safer world. Instead, it’s one with a similar number of, or even fewer, storms, but far more dangerous ones. Over four decades, total North Atlantic named storm and hurricane counts have increased (Figure 1), while the fraction reaching major intensity has risen sharply. The 2020s are averaging a 50% major hurricane conversion rate, versus 33% in the 1980s.
The stabilisation argument is plausible. In the context of actuarial risk, it can also be misleading. A world with fewer storms but more Category 5s is not a safer world. It is a riskier one, particularly if your model is pricing frequency rather than the intensity ceiling.
There is a further implication most models have not begun to account for. Fewer weak storms means less vertical mixing of the ocean surface and less depletion of ocean heat content across the season. That preserved heat is available, in higher concentrations, to the intense systems that do form. Stability is not just suppressing weak storms--it is reserving the fuel supply for the ones that matter most.
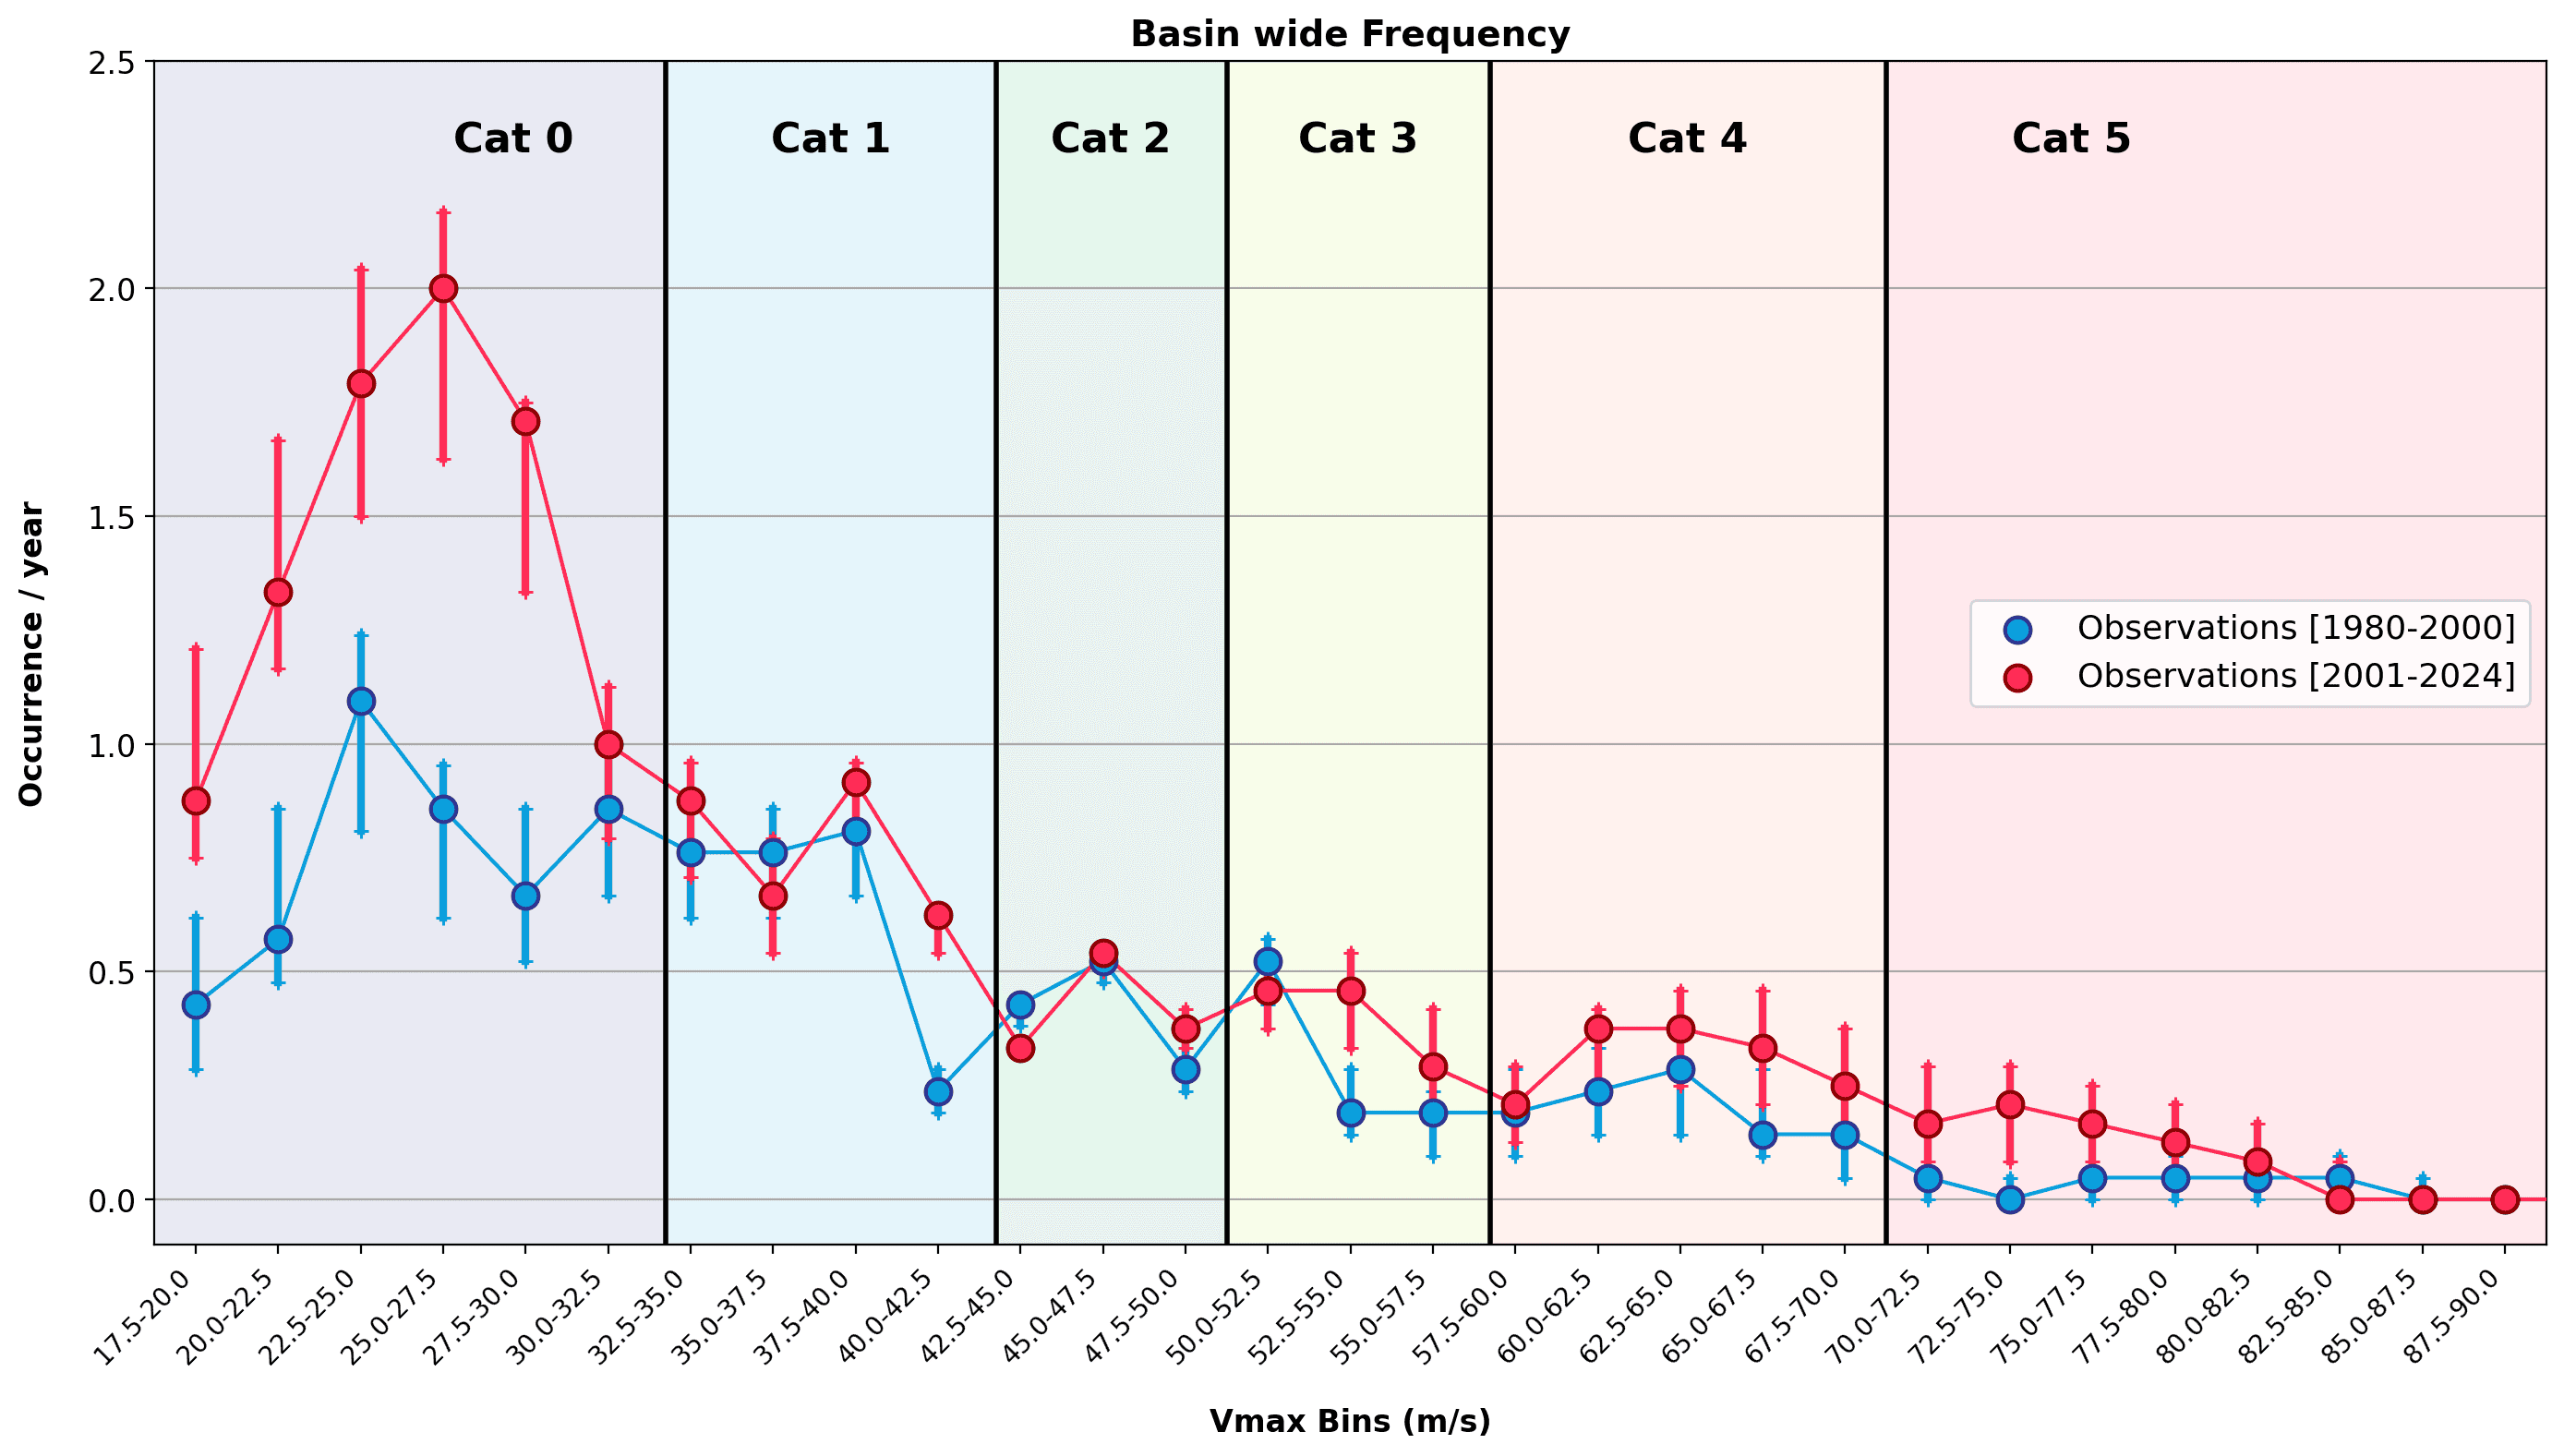
Figure 1: Basin wide observed occurrence of Cat0 to Cat5 storms in the North Atlantic basin over two periods: 1980-2000 (blue) and 2001-2024 (red). The dots show observed activity with the red arrows highlighting the observational uncertainty (5-95th quantile by adding +/- 1.25 m/s [half the 5kt IBTrACS reported wind error] with 1000 random draws).
Why plausibility is not enough
The stabilisation argument is physically coherent. The mechanism is real; increased vertical static stability does suppress convection; mid-tropospheric drying does make it harder for nascent systems to organise. These effects show up in the data.
But a physically coherent argument that is not validated against the observational record is not a credible scientific position on which to base future decisions. It is a hypothesis. The observational record does not show declining Cat 3+ conversion rates as SSTs rise. It shows the opposite. A model grounded in the direct thermodynamics of the system, warmer ocean, more energy, higher intensification probability reproduces the observed behaviour, and sets the risk ceiling.
This is how you validate plausible arguments: by asking which survives contact with the data.
For physics-based models, historical reproduction should appear as validation rather than calibration. The historical record becomes a test of the methodology rather than a target. Pass it and you have earned the right to say something about the present.
What credible actionable science requires
It must reproduce history
Any model that claims to offer a forward view of risk must first demonstrate it can reproduce the past. Storm counts, intensity distributions, decadal trends, landfall counts. This is the minimum threshold. It is also how you distinguish between competing arguments: run them both through the physics, see which one matches reality.
It must reflect current conditions
Legacy cat models are sophisticated resamples of history. They project the statistical distribution of past events forward. If the climate were stable, this might be acceptable, at least for the more frequent events. But that’s simply not the case today amid growing non-stationarity. By contrast, a model driven by current sea surface temperatures, current atmospheric stability, and a current thermodynamic energy ceiling does not suffer from this flaw. When real-world conditions change, the risk view must change with them, or else it will be dangerously out of date.
It must make uncertainty explicit
Credible risk science quantifies the range of plausible outcomes, considers the statistical tail explicitly, and is honest with decision-makers about what it knows and what it does not. That is not weakness. It is the basis for genuinely defensible decisions.
Evaluating scientific arguments
Plausible arguments make it into the model once validated. The following criteria provide a structured basis for distinguishing between a scientifically defensible position and one that is plausible. Apply them to any claim, from a published paper, a broker note, an academic advisory, or a conference presentation, before allowing it to influence your risk view.
Criterion | The test question | What to look for | Verdict |
|---|---|---|---|
1. Candidates - academic consensus | Is the proposed mechanism broadly accepted across the peer-reviewed literature, or does it represent a minority or contested position? | Convergence across independent research groups and datasets. A single credentialled voice or a paper that contradicts the weight of evidence is not consensus. | ✓ Passes if broadly supported |
2. Data-driven | Does the signal survive the data without human intervention? | The claimed effect should be visible in the data used to build the model. Plausible physics that leave no observable or verifiable fingerprint fail this test. | ✓ Passes if identifiable in the data |
3. Quantifiably validated | Can the mechanism be reproduced by a physics-based model that has been tested against historical observations? | The model must generate outputs statistically consistent with the record before it can claim to say anything about the present or future. Reproduction acts as validation. | ✓ Passes if model-reproduced |
Evidence of this validation underpins the Reask model development cycle. Looking back to when we first started building the model in 2018 there was a school of thought that we were nearing the end on the AMO+ cycle which would have a significant impact on tropical cyclone activity (decreasing).
While this was a plausible argument at the time, we couldn’t confirm it from available data without including some level of subjectivity. As a result, we couldn’t confidently include it in our model. That argument has now gone away, and our model survived the test of the years post 2018.
How Reask’s UTC model captures North Atlantic basin-wide activity
The Reask Unified Tropical Cyclone (UTC) model powering DeepCyc simulates global hurricane activity by incorporating the key physical drivers of sea surface temperatures, wind shear, mean sea level pressure, and steering patterns.
Validation of the UTC model against observed North Atlantic activity across intensity bins (Vmax) for 1980–2000 and 2001-2025 confirms that the observed intensity distribution emerges directly from the model physics, rather than being imposed as a calibration target (Figure 2). This demonstrates that the model captures the underlying dynamics of hurricane behaviour over the period and is quantifiably validated. Thus, the model survived the test!
Figure 2: Animation of North Atlantic basin wide frequency as a function of Vmax for the periods 1980-2000 and 2001-2025. The box plots show simulations from Reask’s UTC model. The dots show observed activity with the red arrows highlighting the observational uncertainty (5-95th quantile by adding +/- 1.25 m/s [half the 5kt IBTrACS reported wind error] with 1000 random draws)
The defensible position
The goal is not to resolve every open question in tropical cyclone science. It is to have a view of risk you can defend with genuine confidence.
That position sounds like this: our risk view is grounded in the physics of the current climate system. Our model reproduces the historical record; that is how we validated it. It is responsive to current conditions, and it makes its uncertainty explicit.
The changing climate is clearly changing the risk landscape. The question now is whether your model knows it and can tell you why.
Plausible arguments are everywhere. Science that is validated, reproducible, and grounded in today’s conditions is not. The tools exist. The question is: Are you are using them? And since the science and climate continue to evolve, our work doesn’t stop here. Any framework robust enough to use in an era of rapid and complex change must be able to absorb new information, test new physics, and produce views that are genuinely defensible, and that’s exactly what Reask seeks to do.
So now...it’s three months before hurricane season. You sit down to review the science. You read about record sea surface temperatures, rising major hurricane conversion rates, three Category 5s in a below-average season. You read the stabilisation argument too. Someone asks you: which signals win?
This time you have an answer. You’re not burdened by feeling like you need to almost arbitrarily settle the science, you have a model that has already been tested against the observational record, and you know which arguments survive that test and which don't. Your risk view is grounded in validated physics, responsive to current conditions, and honest about its uncertainty. You can explain it, defend it, and act on it.
That is the difference between plausible and useful.
About Daniel Swain, PhD, Reask climate advisor
Dr. Daniel Swain is a climate scientist specialising in extreme weather and climate change. He is widely recognised for his work on the drivers of storms, floods, and other extreme events.


