The newsletter for climate-aware risk professionals.
The climate producing today's storms is not the climate that produced the historical record. Join 400+ risk professionals receiving the latest insights from Reask direct to their inbox.

Insights
5 parametric hurricane triggers, and where they quietly break
Five parametric hurricane triggers. One question none of them answer: what wind speed did your location actually experience?

David Schmid
|
Global Head of Data Products

A Category 4 storm enters the circle. The policy triggers a full payout. But the insured location, 50km from the eye, experienced low Category 1 winds and little damage.
Meanwhile, 50km in the other direction of the track, a facility took the full force of the eyewall, causing high losses. Property damage, business interruption, non-damage BI.
“Circle missed, sorry, no payout.”
Two sites, same storm, opposite outcomes, and neither payout matched reality. This isn’t hypothetical. Hurricane Charley did exactly this in southwest Florida in 2004.
Parametric insurance exists to deliver speed and certainty when traditional indemnity cannot. The harder question only emerges after a few renewals: which parametric hurricane trigger actually does what you think it does?
What is the proxy gap?
Call it the the proxy gap: the gap between what the trigger measures and what actually happened at the insured location.
Cat-in-a-Circle, simplified wind models, physical anemometers, observation-based reconstructions: they all measure a proxy. Distance from the storm centre. A simplified physics estimate. A sensor reading from somewhere else.
None of them answer the question that actually matters: what wind speed did the insured location experience?
Here's where each one breaks:
Cat-in-a-Circle: familiar, authoritative, and misaligned with impact
CIC doesn’t measure what happens at your location. It measures whether the storm centre crosses a geometric boundary.
Cat-in-a-Circle, also known as cat-in-a-box/shape/polygon, remains the incumbent parametric structure for a reason. It is easy to explain and directly tied to official NHC storm data. To be fair: for small placements where the premium is low and the stakes are manageable, the trade-off may be acceptable.
But as exposure values rise, it becomes harder to justify. Within a typical 50km circle, the insured location may experience anything from tropical storm conditions to major hurricane winds, depending on storm size, asymmetry, translation speed, and relative position.
This leads to two uncomfortable outcomes: First, a payout can trigger when the insured location experienced minimal wind, making it difficult to justify internally, contractually, or to regulators.
Second, all of these low-impact trigger events are fully priced in, at the same weight as events that cause full damage. You could say that the buyer is paying premium for random risks tens of kilometres away from their site.
There is also a less visible issue near the circle boundary. Official storm track coordinates are rounded to two digits after the decimal point, roughly 10km of positional uncertainty near the Caribbean.
Near the perimeter, this creates a hidden ring of randomness where “triggered” or “not triggered” can hinge on rounding. There will never be more precise official data to resolve this.
If you priced a CIC correctly for this uncertainty, every circle would need a larger radius, and the premium would rise accordingly.
Watch a quick walkthrough of the proxy gap and why it matters for every parametric hurricane policy on the market.
But what about non-damage BI?
This fundamental misalignment is often dismissed by arguing that CIC is better suited for non-damage business interruption than for property damage. The logic sounds reasonable: non-damage BI feels indirect; CIC feels broad; therefore, broad trigger equals broad loss.
The mistake is assuming that distance from a storm centre is a better proxy for disruption than experienced hazard intensity at the location. If wind intensity at your location is high, it's very likely the surrounding area, suppliers, customers, infrastructure, and access routes within a typical 50km catchment are also affected.
Whether the objective is to protect physical assets or operational continuity, the same question applies: what actually happened at the location that matters?
Simplified wind models: still a circle with finer steps
Holland and Willoughby models produce symmetric wind fields, mathematically, a CIC with more granular payout steps.
Some players attempt to improve on CIC by building simplified wind-at-location models. The intent is sound. But look at what they produce: concentric, symmetric isotachs around the storm centre.
Your wind speed is still determined by distance and maximum intensity, the same two variables a CIC uses.
It looks more sophisticated. It isn't. It's a moving CIC.
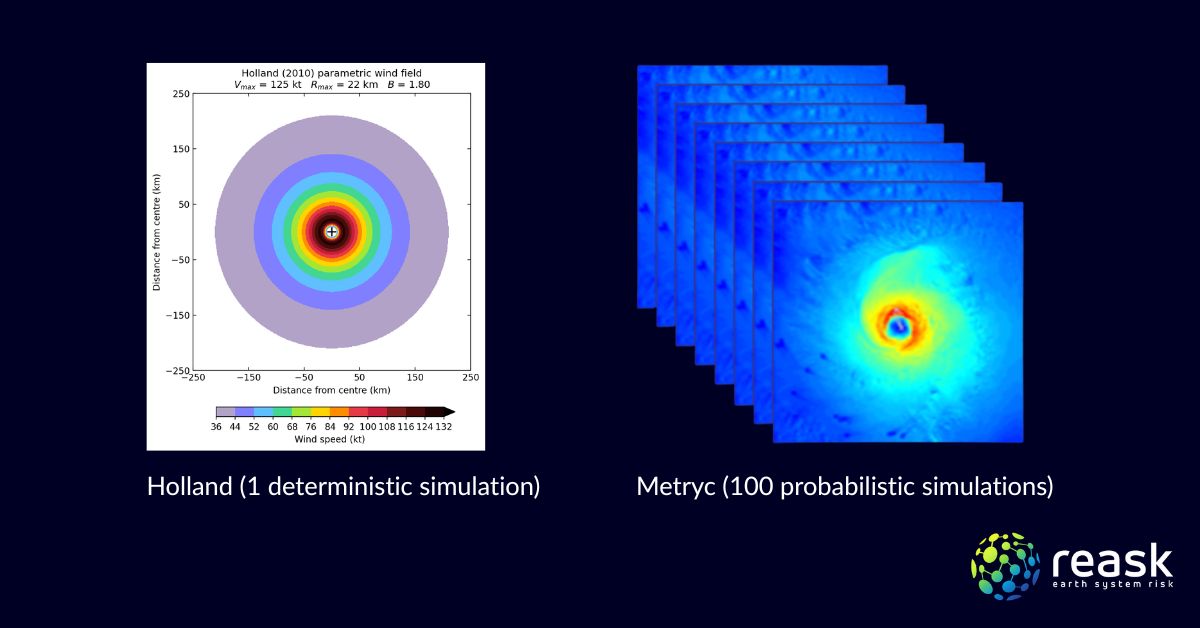
Real storms are asymmetric. In Hurricane Ian (2022) and Milton (2024), peak winds occurred on the opposite side of the storm from what simple models predict. Running multiple simulations doesn’t help, you’re just nudging the same symmetric wind field. The circle moves, but it’s still a circle.
Physical anemometers: precise in theory, fragile in practice
The proxy gap isn’t eliminated. It’s relocated to a fragile instrument somewhere else.
Anemometers fail during extreme events, exactly when the measurement matters most. Even when operational, each instrument is calibrated, maintained, and exposed differently. Two sensors a short distance apart can report materially different wind speeds.
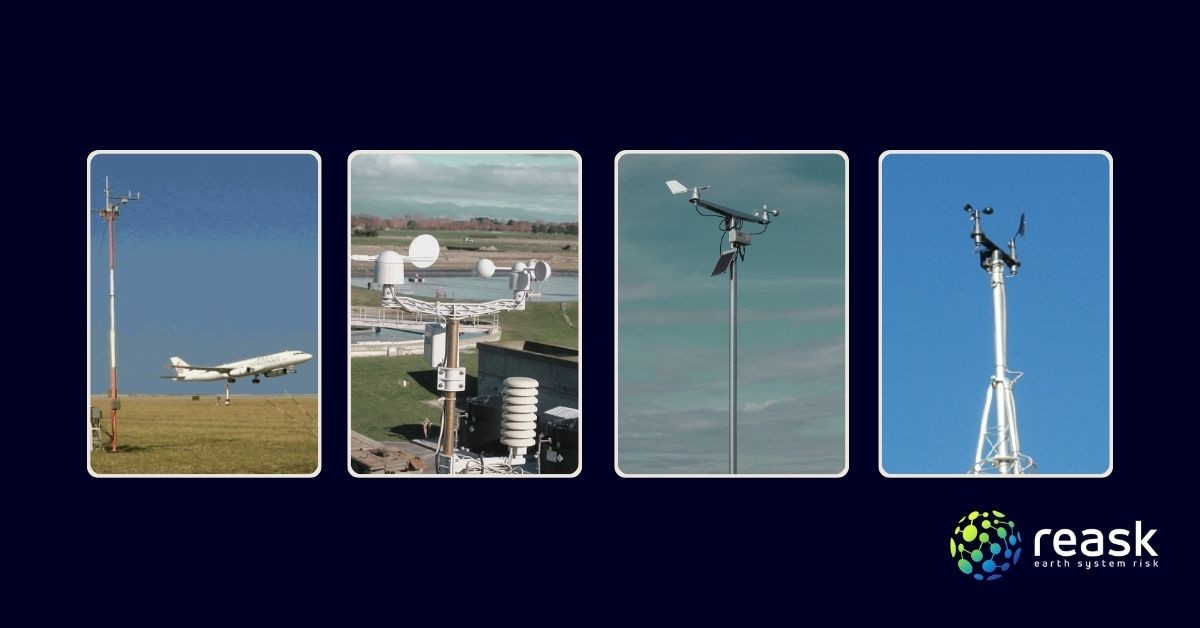
Most official anemometers sit at airports, not where insured assets are. Privately installed sensors introduce mounting height, shielding effects, and moral hazard concerns. The result is a trigger that appears precise but is operationally brittle and impossible to standardise across portfolios.
Other windfield models: observation-based, but inconsistent and unscalable
Other models can’t produce consistent historical footprints making robust back-testing impossible.
Competitors' models are known to reconstruct wind fields from observed station data, inheriting every limitation of physical sensors: sparse coverage, inconsistent calibration, operational fragility. Where observations are insufficient, these models fall back on the same idealised parametric wind models it was meant to improve upon.
The station network available today did not exist for historical storms. Without footprints for Hurricane Andrew (1992), for example, consistent back-testing of payout structures becomes fundamentally impossible.
These models also incorporate expert judgment in their post-event workflow. Different analysts can produce different footprints for the same storm violating a core principle of parametric wind insurance: automated, objective, repeatable claims determination.
Cat-in-a-Shape: geometry with extra steps
Some products replace the circle with a polygon or arrange multiple boxes in a grid pattern. The problem: it’s the same fundamental flaw. You’re still tracking whether the storm centre enters a shape, not measuring what happens at your location. The proxy gap is as present as it is with a simple cat-in-a-circle.
What would actually close the proxy gap?
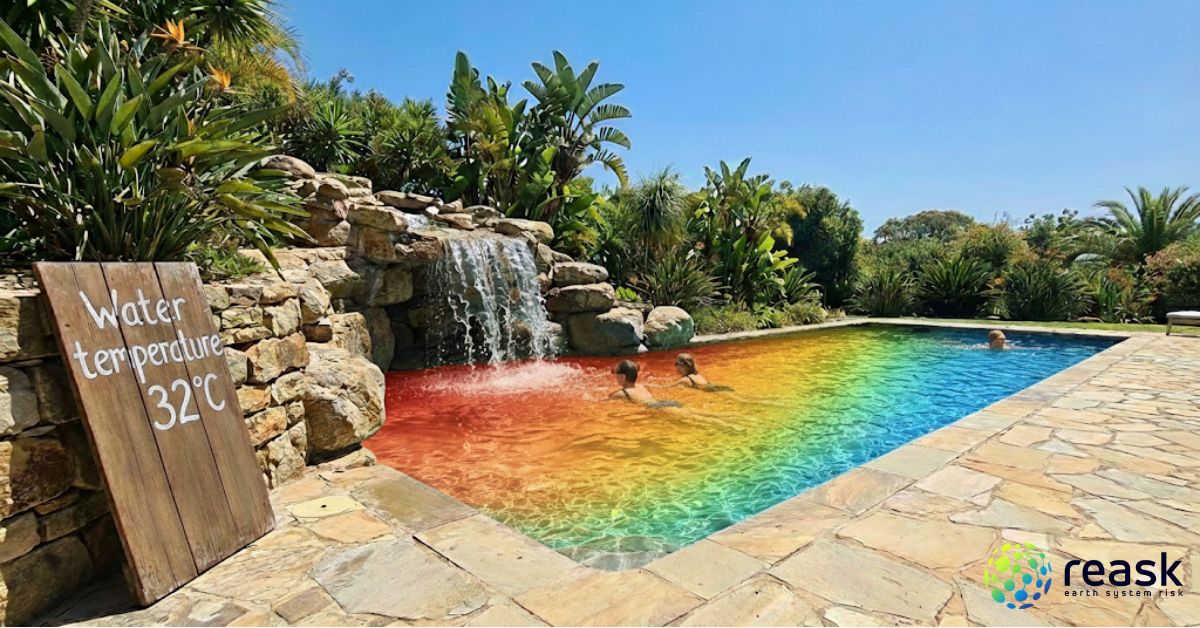
Think of a heated pool. The sign says 35°C. But your experience next to the hot jet is 38°C. Your partner on the other side feels 32°C. A Category 4 label works the same way. One number for the entire storm, telling you nothing about what any specific location experienced.
Your client is hit by winds, not by a category.
A parametric hurricane trigger that actually closes the proxy gap would need to do four things: model the wind speed at the specific insured location; account for terrain and topography; handle the input and modelling; and back-test consistently against every tropical cyclone back to 1945 using the exact same methodology.
That’s what we built Metryc to do.
Metryc starts from reported track data: NHC, JTWC, JMA, BOM, NADI, the same foundation everyone trusts. It models how wind interacts with terrain at your location, runs 100 simulations of every storm varying the parameters to account for uncertainty, and delivers the 50th percentile, the most probable wind speed.
Wouldn't 100 runs of a Holland or Willoughby model capture that uncertainty as well? No. These models produce symmetric isotachs by construction, no asymmetry, no terrain interaction. Vary the inputs and you get 100 versions of the same symmetric pattern. The circle moves. The circle stretches. The circle stays a circle. Running it 100 times doesn't capture uncertainty in what the storm actually did. It's just a moving CIC and you would end up with a confidence interval around the wrong answer.
The fundamental question is: Do you prefer one wrong answer, or the most likely answer?
We don’t claim reality or perfection, but we can get you the most likely windspeeds experienced at the covered assets.
The outcome is intuitive. Higher wind speed at your location, higher damage, higher payout. CIC is simple to understand, but unpredictable in outcomes. Metryc is more complex to explain but the outcomes better match reality. You can defend it. The buyer can explain it to their board.
And because Metryc measures wind at your specific location rather than across an entire region, you only price the 1km² that matters rather than the tens of thousands of square kilometres that a CIC charges for, leading to a significantly lower risk premium. Better loss alignment and lower cost.
Want to see what Metryc returns at your locations? Get in touch for a walkthrough.


