The newsletter for climate-aware risk professionals.
The climate producing today's storms is not the climate that produced the historical record. Join 400+ risk professionals receiving the latest insights from Reask direct to their inbox.

Research
Reask UTC: a machine learning modeling framework to generate climate-connected tropical cyclone event sets globally
The peer-reviewed research behind Reask's approach to climate change catastrophe modelling: how the unified tropical cyclone (UTC) model connects global climate data to tropical cyclone behaviour, and the test showing it reproduces the historical record.

Paper title | Reask UTC: a machine learning modeling framework to generate climate-connected tropical cyclone event sets globally |
|---|---|
Authors | Thomas Loridan, Nicolas Bruneau (Reask) |
Journal | Natural Hazards and Earth System Sciences, Volume 25, 2863–2884 |
Published | 26 August 2025 |
Peer review | Peer-reviewed. Received October 2024, accepted May 2025. Edited by Gregor C. Leckebusch; reviewed by Ralf Toumi and Nadia Bloemendaal. |
DOI | |
Why a model built on history struggles with a changing climate
Since the early 1990s, insurers have used large sets of synthetic tropical cyclone events to measure risk beyond what the historical record holds. These event sets come from statistical extrapolation of past storms. They reproduce the climatology of history and let an analyst estimate return periods, such as the wind intensity with a 1% annual chance of occurrence.
The design carries a built-in limit. The events are fit to the statistics of past storms, so the model represents risk best under the conditions it has already seen. Two problems follow from that. A model anchored in past climate cannot quantify how risk moves as ocean temperatures, steering winds, and vertical wind shear change. And a model trained on the historical record performs well where records are dense, such as the North Atlantic, while generalising poorly to basins where storms are under-observed, such as the South Indian Ocean.
What a climate-conditioned catastrophe model does differently
The UTC framework connects the event generator directly to the state of the climate. It reads global gridded climate fields and uses them to drive every stage of storm generation. The historical climate comes from the ERA5 reanalysis; alternative climates come from the CESM LENS2 project, which lets the model sample climate states the record did not happen to produce.
The climate inputs are the variables known to shape tropical cyclones: ocean surface temperature, mean sea level pressure, winds at the lower and upper levels of the atmosphere (850 and 200 hPa), vertical wind shear, and steering flow. The framework reduces these fields to 13 patterns it calls climate connectors, then links those connectors to storm behaviour through two families of algorithm:
Counts by basin. A hierarchical Bayesian model sets how many storms a basin produces in a season, conditioned on the connector values for that climate state.
Tracks and intensity. Quantile regression forests model the hourly change in a storm’s position and central pressure, conditioned on steering flow, wind shear, and ocean temperature at each step. Each forest returns a full distribution at every hour, so the framework can sample many plausible storms from the same climate state.
Run across millions of events, the result is a catalogue of storms tied explicitly to the climate conditions that produced them.
Two dimensions of risk
Any view of tropical cyclone risk has to sample two kinds of variability. The first is how much storm activity varies within a fixed climate, the year-to-year and weather-scale noise. The second is how much the climate itself varies. The paper labels these dimension A and dimension B.
Most traditional event sets sample dimension A for a single historical average climate and treat dimension B as fixed. The UTC samples both. It runs many climate states through the generator, which lets it ask questions a static model has no way to reach: how landfall risk shifts between El Niño and La Niña years, and how much of the risk in any single record is down to the particular climate that happened to occur.
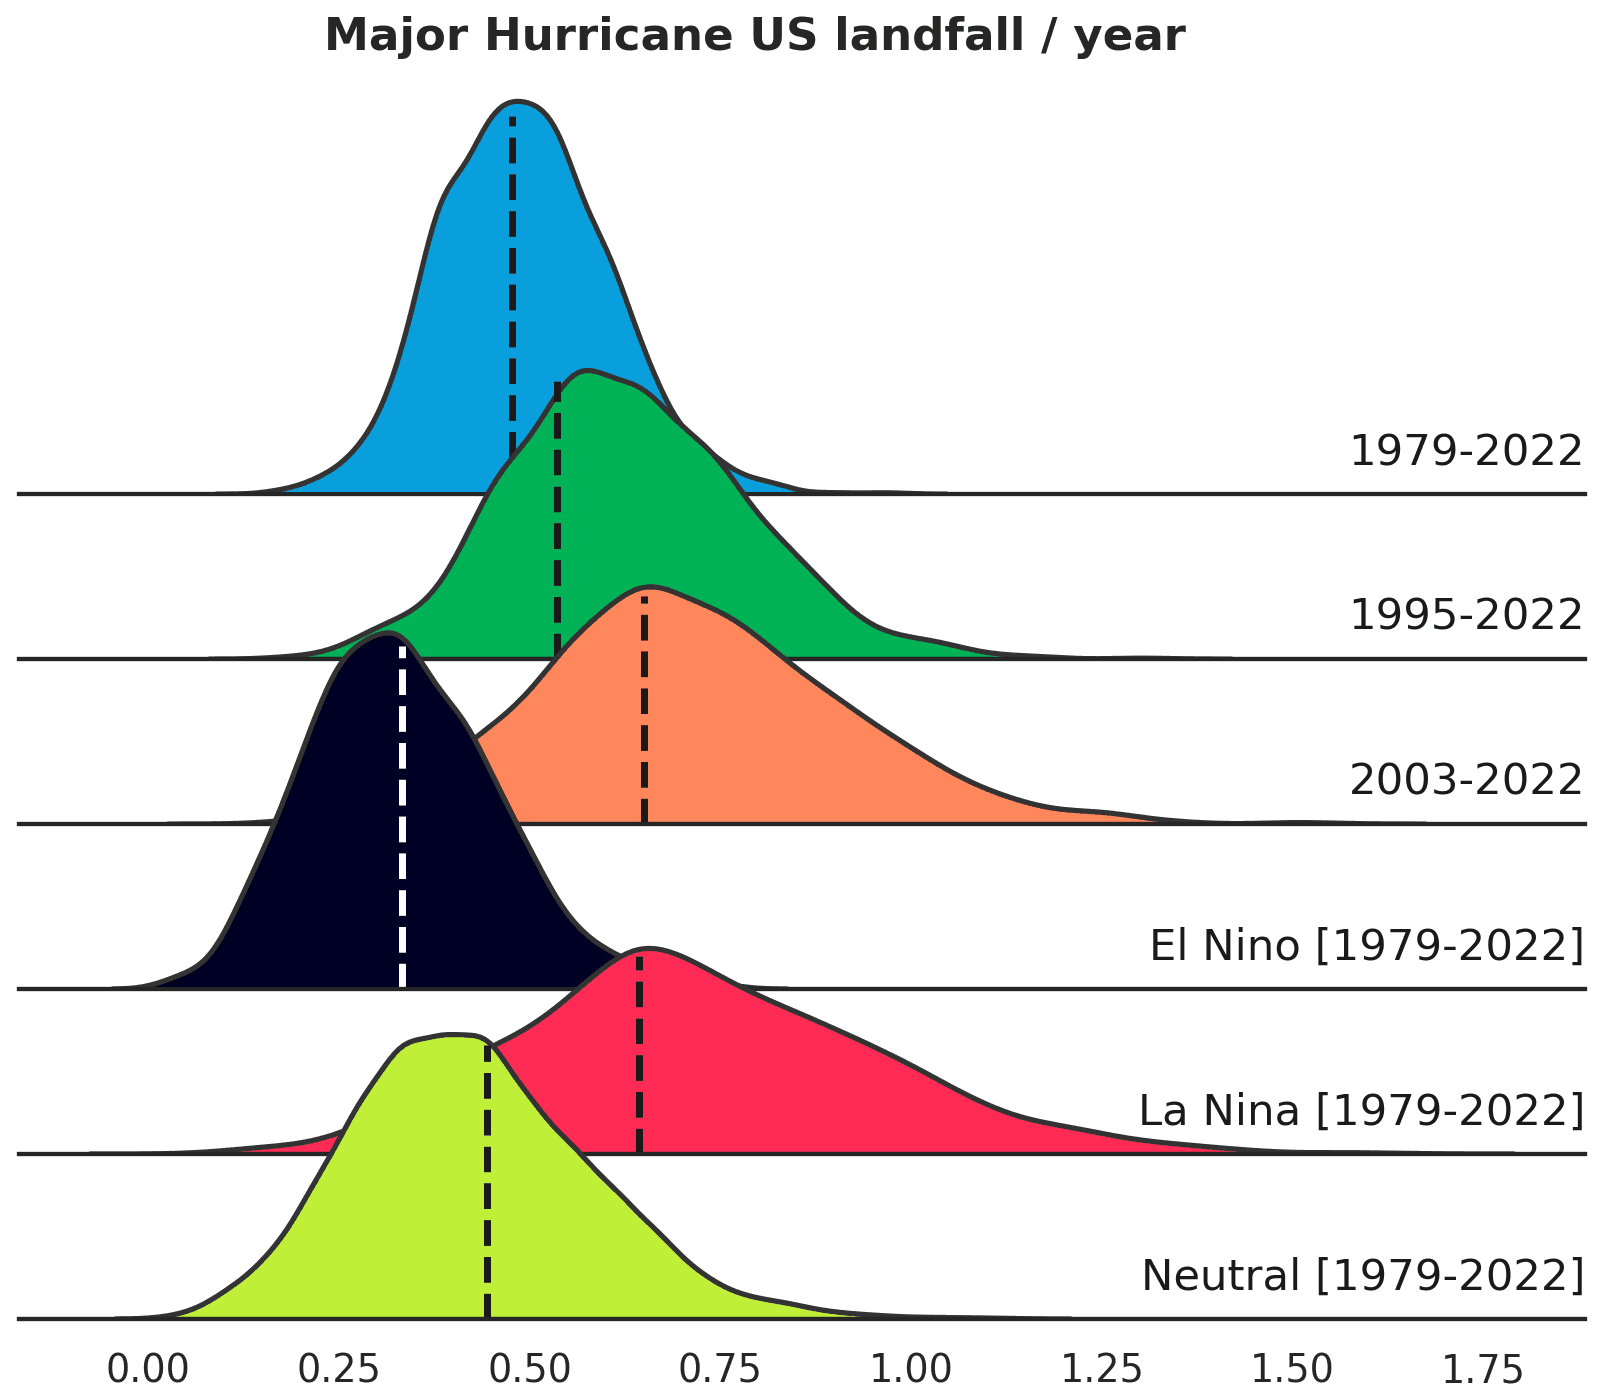
Figure 1: UTC modelled distributions of annual US major hurricane landfalls under different climate forcings, with observed levels marked. Source: Loridan and Bruneau (2025), CC BY 4.0.
How the model builds a storm
For each climate state, the UTC repeats the same sequence to generate a season of storms:
Sample the number of storms in each basin from the count distribution for that climate.
Place each storm’s genesis point and date, adjusting the historical pattern for local ocean temperature and wind shear anomalies.
Step the track forward hour by hour, sampling the next change in latitude and longitude from the steering conditions along the way.
Step the intensity forward in parallel, sampling the change in central pressure from wind shear and ocean temperature.
Draw a dissipation probability at each step until the storm decays.
Convert central pressure to maximum sustained wind, the metric used to size damage and to place storms on the Saffir-Simpson scale.
What the evaluation found
To test the framework, the authors forced it with ERA5 climate data for 1980 to 2023 and generated 110,000 years of storm activity, 2,500 simulated versions of each of the 44 years.
The check is whether the real record sits inside the modelled distribution. It does. Observed annual named-storm counts fall within the model’s central 50% interval in 64% of cases, and within the 90% interval in 94% of cases, across all six active basins.
Spatial patterns line up as well. In the North Atlantic, where the observational record is strongest, the regions the model expects to see Category 5 winds match the historical footprint along the Caribbean islands, the Gulf of Mexico, and southern Florida. For return periods at major coastal cities, from New Orleans and Miami to Tokyo, Manila, and Port Hedland, the historical points fall inside the range the model produces in every case.
The climate we lived through was one sample
The 44 years of records we have are one draw from a wider set of climates that could have occurred. To measure what that costs, the authors ran a further 550,000 years using 50 alternative climate simulations from CESM LENS2 over the same 1980 to 2023 period.
The gap it exposes is concrete. At the Category 5 wind threshold, the ERA5 record alone puts the return period for the Louisiana coast at 40 to 45 years. Once the alternative climates are included, the range runs from 40 to 80 years, which suggests the climate Louisiana actually experienced sat on the unlucky side for hurricane risk. On the Carolina coast the same threshold moves from a 160 to 180 year estimate under the single record to a 100 to 300 year range once the other climates are sampled.
Reading a single record as the whole story understates how wide the risk actually is.
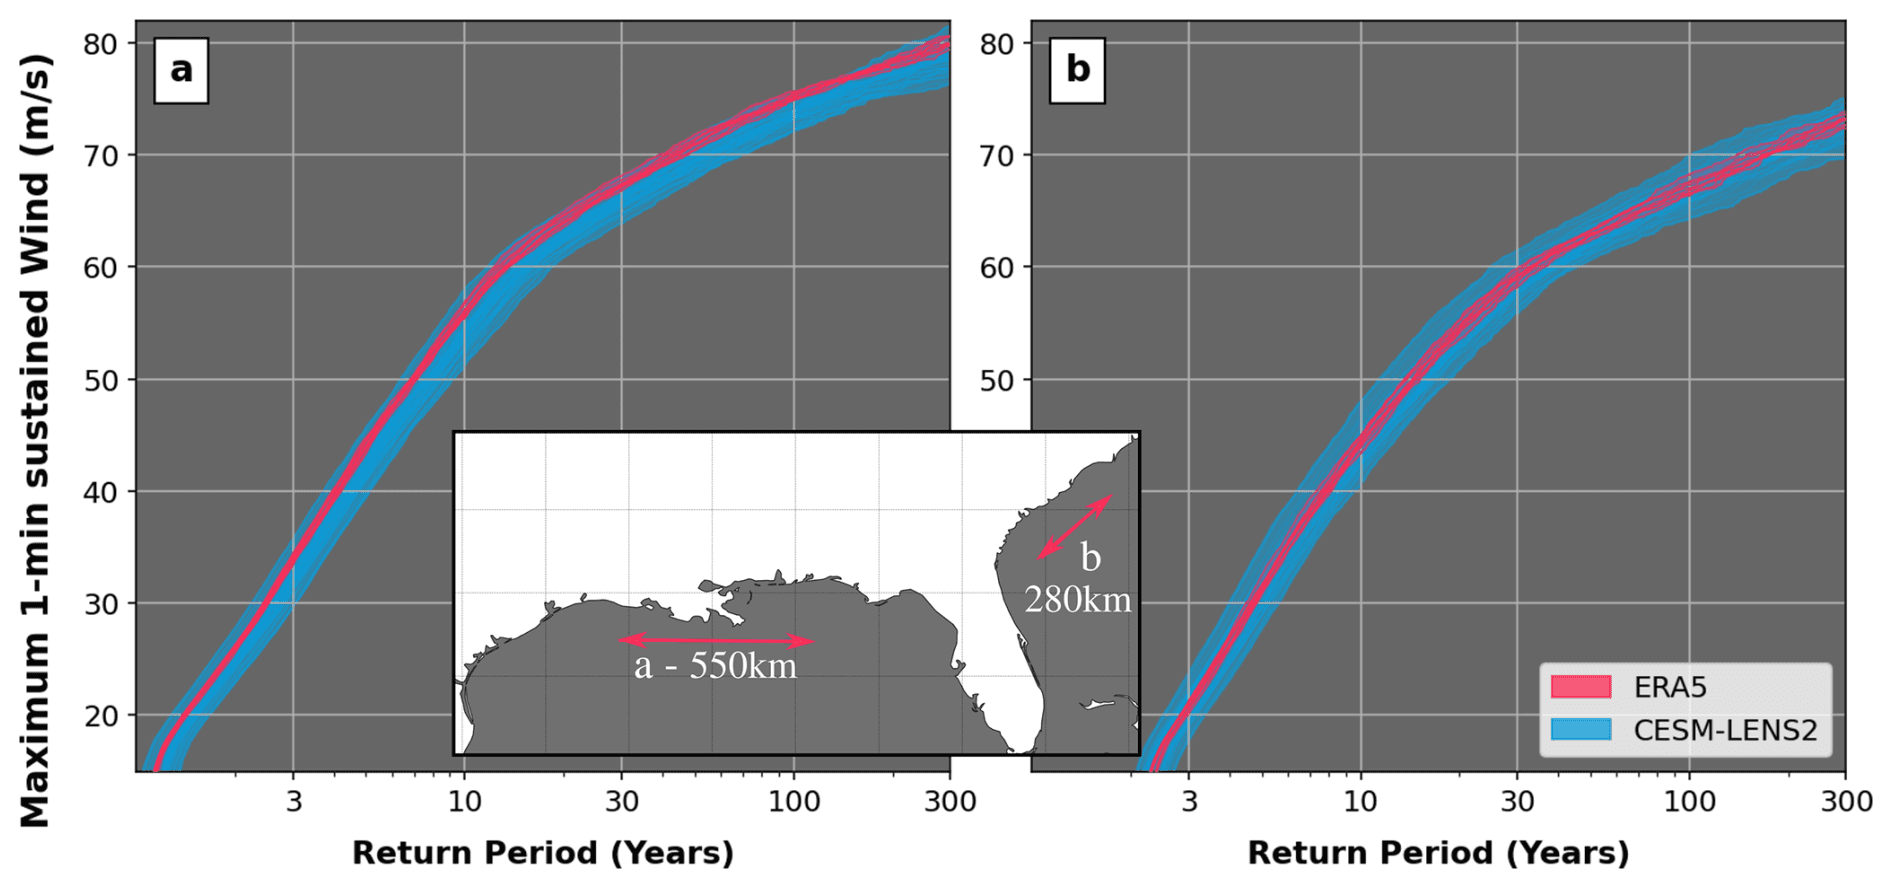
Figure 14: Category 5 return period curves for the Louisiana and Carolina coasts: ERA5-driven view (red) against the wider CESM LENS2 set (blue). Source: Loridan and Bruneau (2025), CC BY 4.0.]
Quantifying the effect of ENSO
Because every storm in the catalogue is tagged with the climate state that produced it, the framework can isolate the effect of a climate cycle directly. Grouping the events by ENSO phase, the paper shows that major hurricane occurrence in the Gulf of Mexico and Caribbean runs more than 50% higher under La Niña conditions than under El Niño, with the western Mexican coast moving the opposite way.
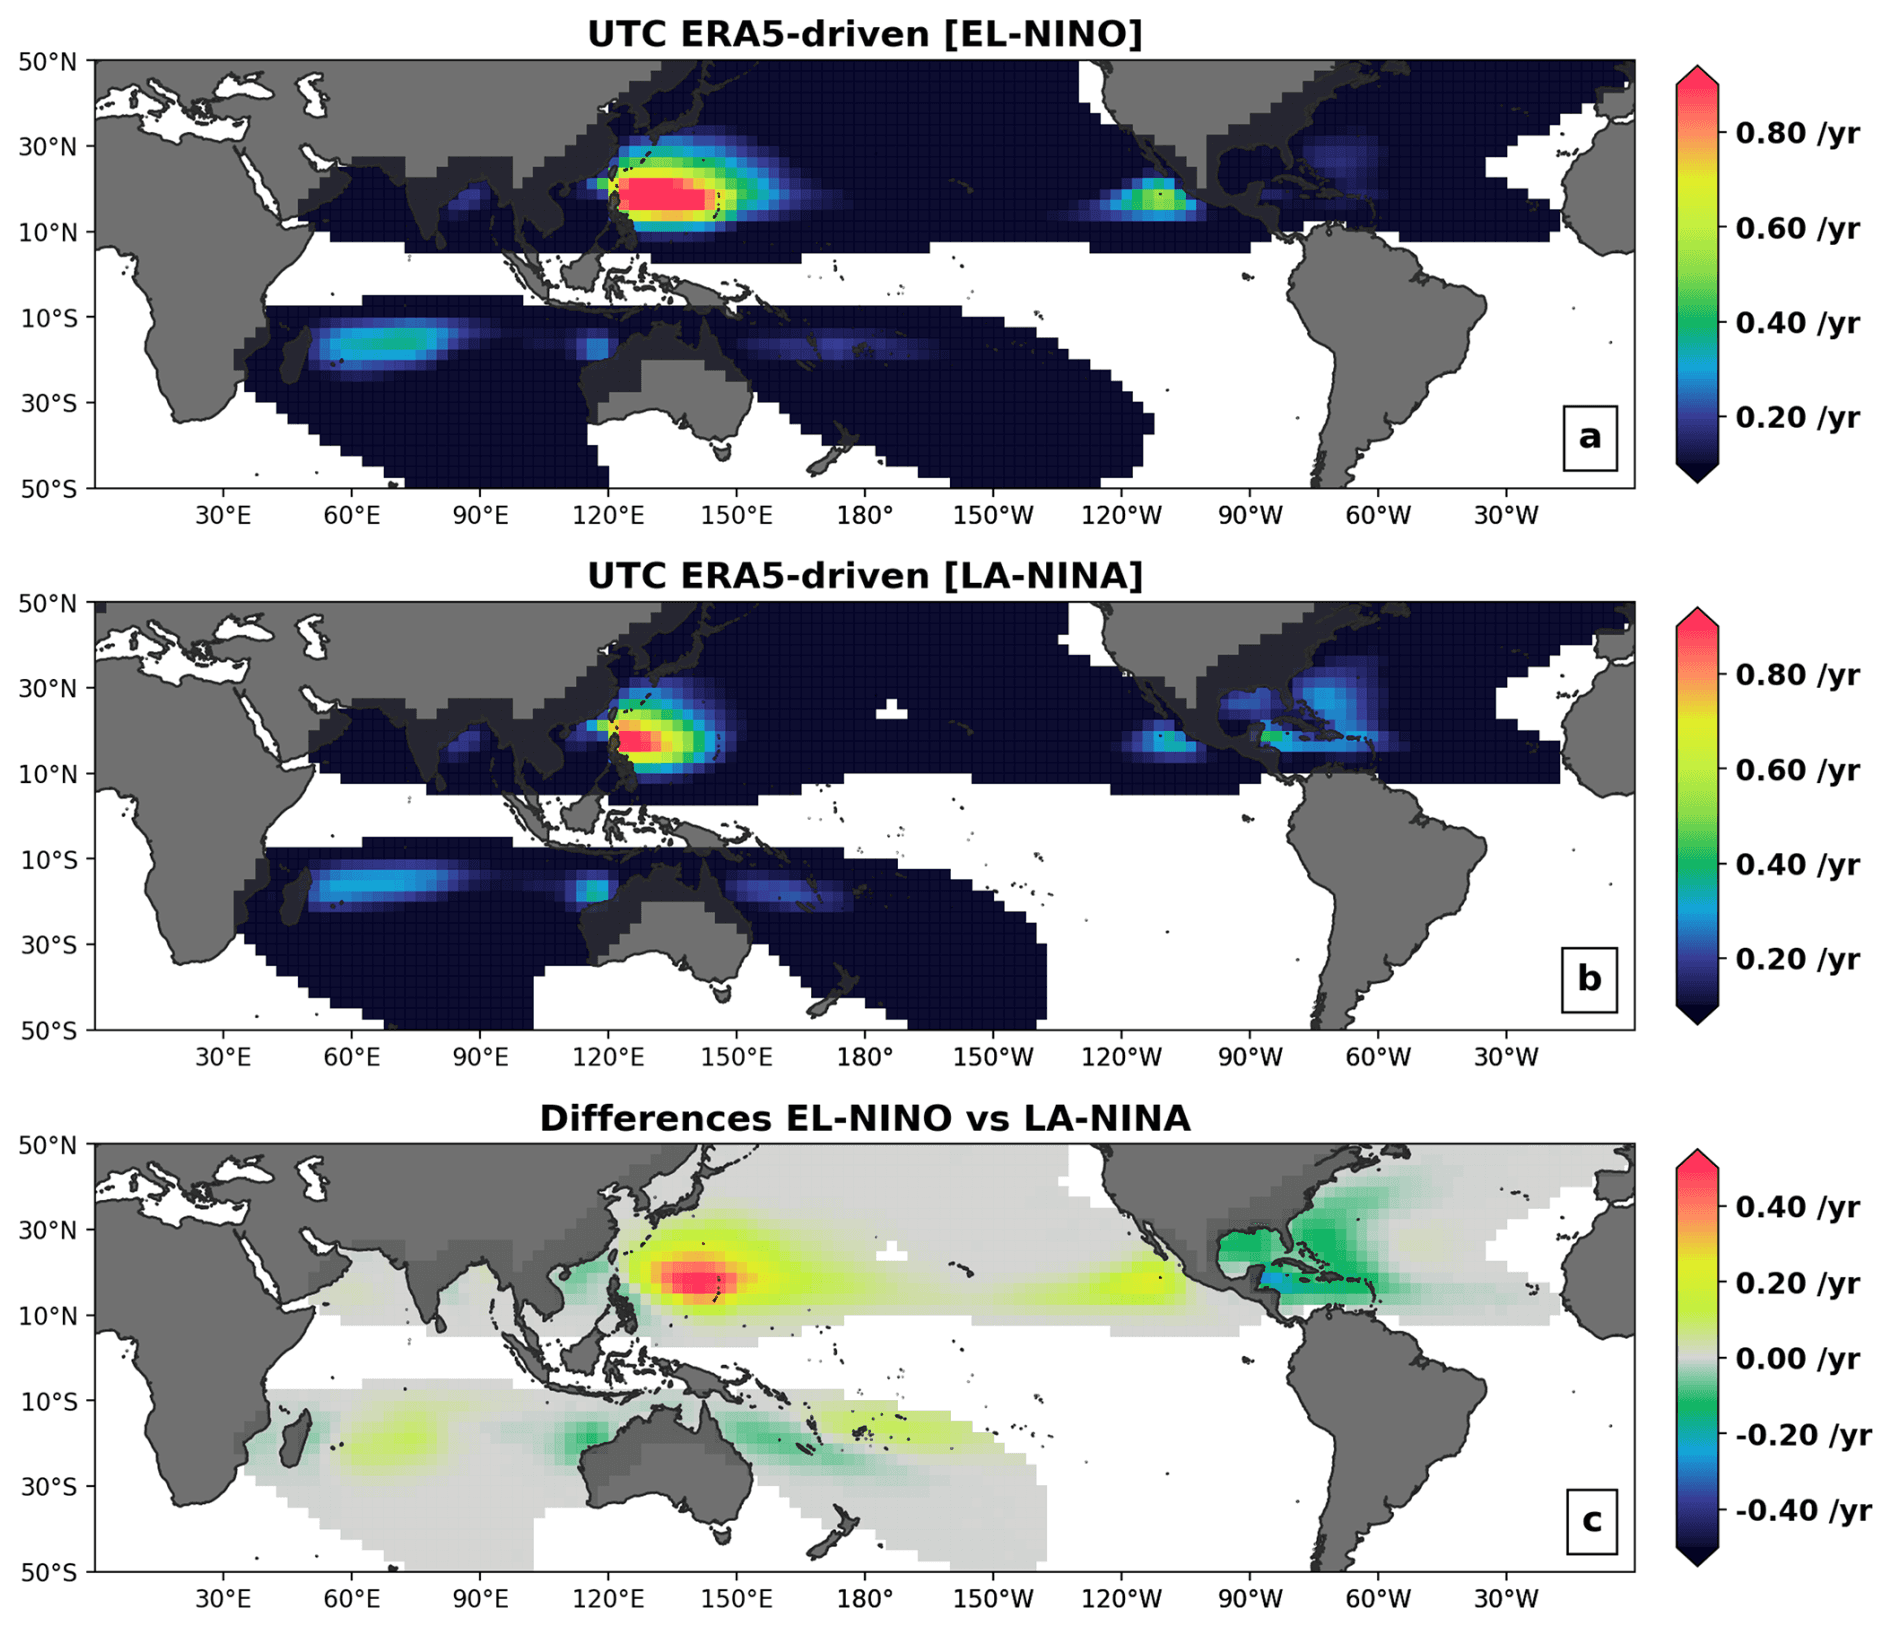
Figure 12: Annual Category 3 occurrence for the strongest El Niño (a) and La Niña (b) seasons, and the difference between them (c). Source: Loridan and Bruneau (2025), CC BY 4.0.
What comes next
This paper covers the UTC run on historical and simulated climates of the recent past. A follow-up study extends it to forward-looking climate inputs: the 51-member ECMWF seasonal forecast for the season ahead, and CESM projections through 2100 for risk over the coming decades. Both feed the climate-conditioned view that DeepCyc puts in front of underwriters and portfolio teams.