The newsletter for climate-aware risk professionals.
The climate producing today's storms is not the climate that produced the historical record. Join 400+ risk professionals receiving the latest insights from Reask direct to their inbox.

Insights
Keeping up with Hurricane Isaias: a side step to the right, then a left hook
Reask tools are designed to capture a wider portion of the likely outcomes and complement forecasts like those from NHC and DeepMind with objective quantification of each subset. This post shows how LiveCyc and Metryc did that for Hurricane Isaias.

Thomas Loridan
Chief Science Officer, Reask

Nicolas Bruneau
Co-Founder, Reask

Balaji Mani
Head of Extreme Events, Reask

Hurricane Isaias made landfall near Destin, Florida on the evening of October 9th. From a forecasting point of view, the evolution of the storm in the days leading to that landfall was challenging due to high levels of uncertainty at two different scales:
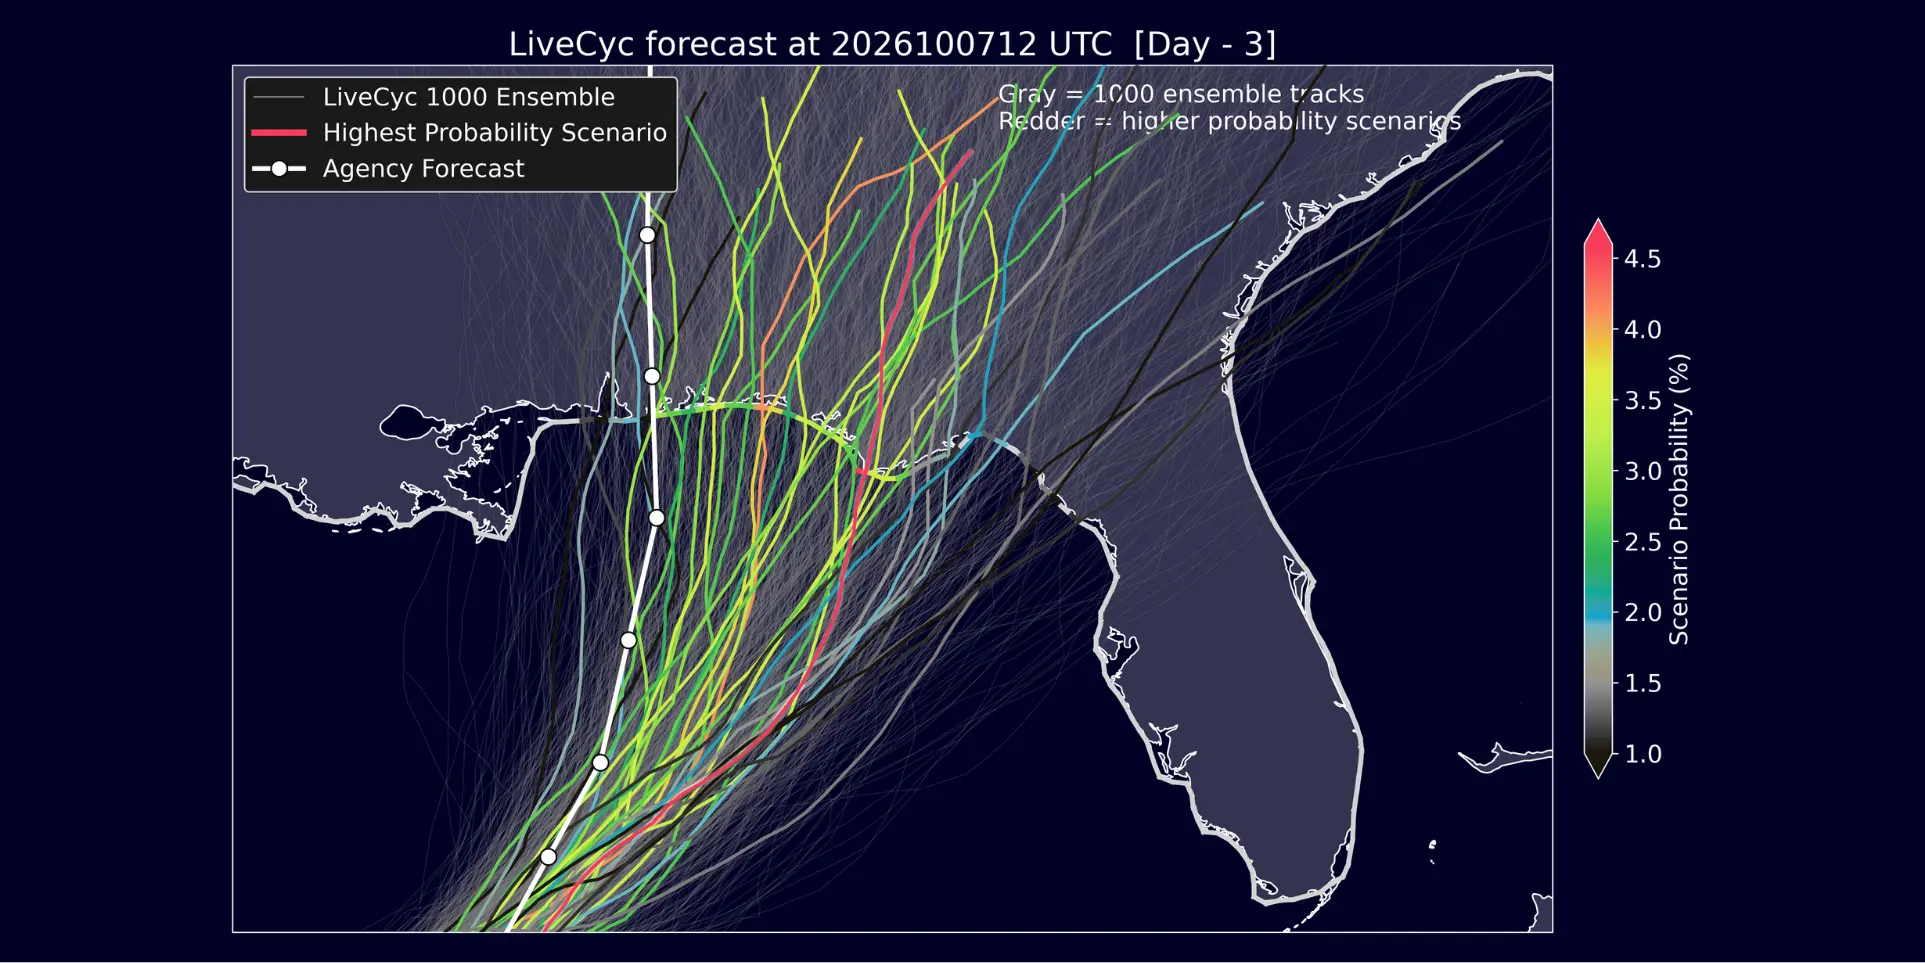
First, the track uncertainty days ahead. With the rise of AI-based models, forecasters were faced with two diverging path projections: for their 10-07 00UTC forecast the NHC, along with traditional physics-based models, portrayed a landfall to the west of Mobile (AL). AI-based models, led by Google WeatherLab’s DeepMind, anticipated a shift further to the east and closer to Fort Walton (FL).
Second, the wind field structure at landfall. While the Google school of thought turned out to be the closest to the truth (see below), Isaias decided its eventual impact would not be solely defined by its trajectory. When it came to surface level winds at landfall, the system developed an atypical structure that delivered a strong left punch, with peak wind gusts recorded to the left of the center, rather than the more traditional right-hand side.
How can Reask solutions help in such a situation?
As with most of our solutions, we do not position our data as a challenger forecast competing with existing agency and other models’ projections. Instead, our role is to augment these views to help capture the full forecast uncertainty, with objective quantification of likely scenarios. That’s the cat modeling approach applied to operational forecasting.
Quantifying track uncertainty with LiveCyc
The NHC and DeepMind offered two distinct views of track trajectories, a frustrating situation for anyone needing to prepare for the likely impacts. Who wants to choose between the official agency and a Google model that has shown it can outperform it?
That’s where Reask comes in. Not to offer a third view, but to capture the full distribution of likely outcomes (including the ones covered by NHC and Google’s ensembles) and quantify their likelihood.
Looking at the 1000 LiveCyc simulations generated on October 7th at 00UTC (Fig. 1 below), we found that 452 make landfall in the NHC cone (white coastal gates), while 621 do so within the spread covered by the Google members (blue gates). In other words, LiveCyc assigns a 62.1% likelihood to a landfall within the region covered by Google and a 45.2% chance to the NHC one.
Going further, we can look into the non-overlapping situations, and according to LiveCyc simulations the likelihood of a landfall falling in a region covered by Google members but not the NHC cone is 30.6% while the chance of it being in the NHC cone but outside of the Google spread is only 13.7%. The likelihood of a landfall at the intersection of both views is 31.5%, making it the most probable subset (and the one where the eventual landfall did occur).

Fig. 1: Reask LiveCyc simulations (lime) along with Google DeepMind members (blue) and NHC forecast (white) for Isaias 2026 on the 7th October at 00UTC.
By mapping out the full spread of projected outcomes, from the western edge of the NHC cone to the most eastern Google members (and beyond), LiveCyc is able to objectively quantify the likelihood of both opinions. In this Isaias case, LiveCyc sided with Google (62.1% vs 45.2%) with more weight to the east.
It is from the Fig. 1 set of 1000 simulations that LiveCyc is able to quantify uncertainty across the likely region of impact. However, we also appreciate that some users would rather focus on a more consolidated set of possible outcomes.
This is why we provide LiveCyc scenarios: one realistic event for every 15 km section of the coastline where at least 5 simulations make landfall. In the case of Isaias on October 7th at 00UTC, this leads to 31 distinct scenarios, each with an explicit probability of occurrence (Fig. 2).
The highest probability scenarios are projecting a landfall just east of the Google members, with the eventual landfall (dashed line) matching the location of the 5th most likely scenario (out of 31).
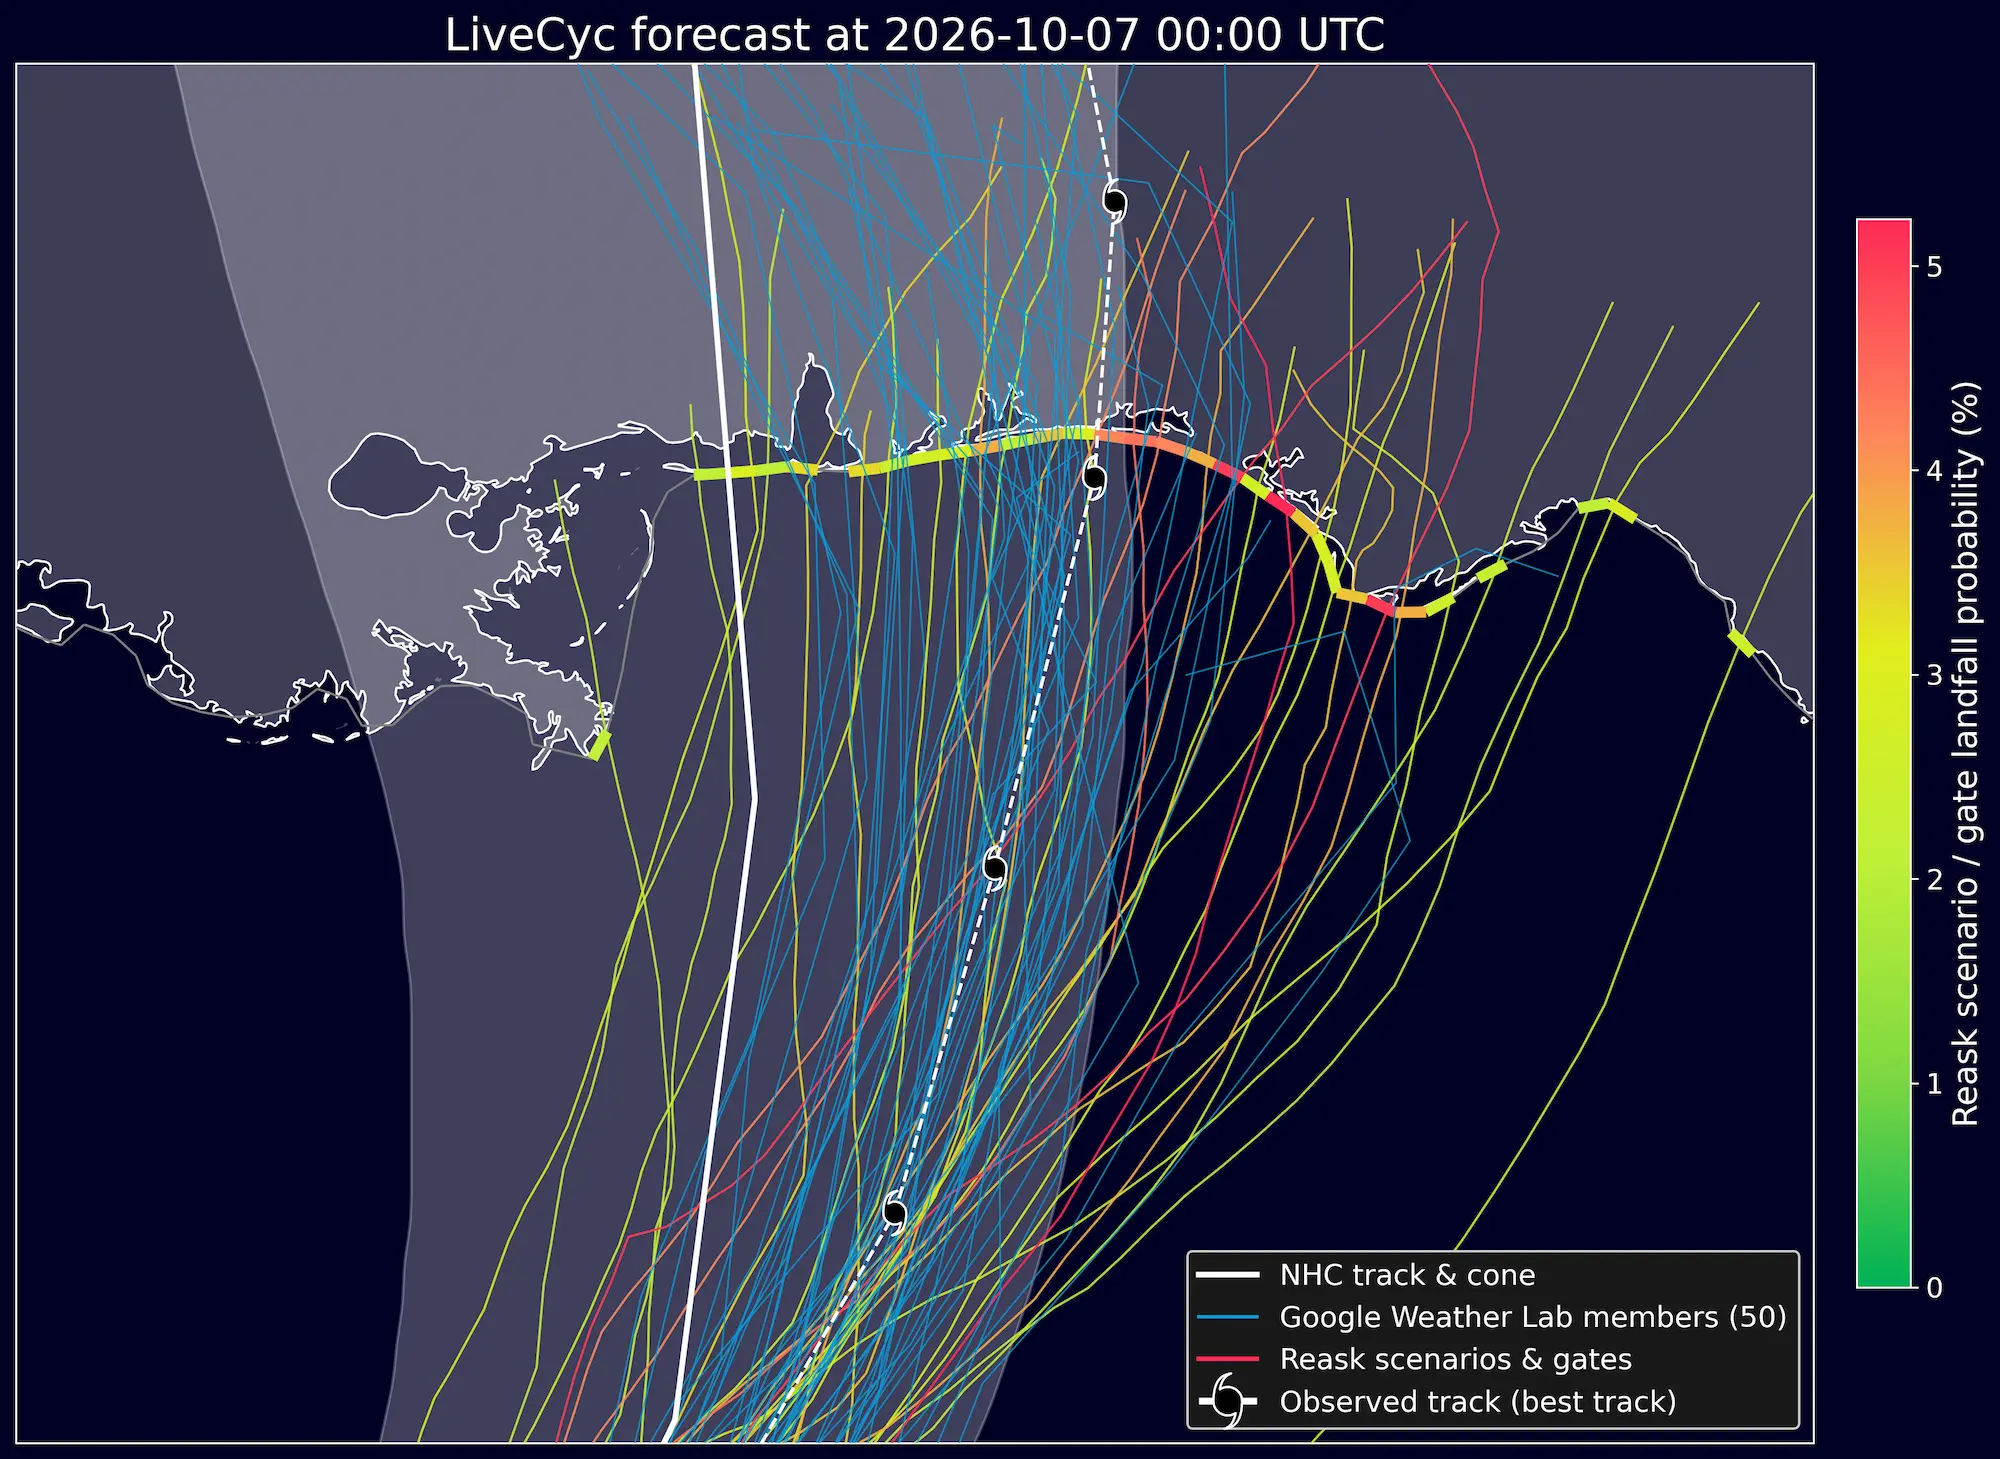
Fig. 2: Reask LiveCyc scenarios color-coded in terms of their llikelihood of occurence (yellow to red colors) along with Google DeepMind members (blue) and NHC forecast (white) for Isaias 2026 on the 7th October at 00UTC.
Granular wind field modeling with Metryc
As the storm approached landfall, uncertainty in the track forecast shrunk, with NHC and AI models mostly aligning on a Fort Walton Beach landfall. However, the location of the storm center does not fully describe the risk to expect on the ground.
While in most northern hemisphere (NH) cases the region of highest surface winds is to be expected to the right of the storm, Isaias decided to punch harder to the left. These left-hand side asymmetries are not the text-book NH hurricane structure, but they do occur reasonably often (e.g. Hurricanes Ian 2022 and Milton 2026) and can move the region of highest impact by 50-100 km from one side of the storm to the other (with onshore winds becoming offshore), therefore significantly changing the profile of risk on the ground.
To capture this uncertainty in fine scale wind structure (including left hand side asymmetries), our Metryc system models 100 different wind field possibilities and outputs probabilistic estimates of the surface gusts to expect. Here again, our approach is not to deterministically model a single best-guess structure, but instead to capture all eventualities, and quantify the most likely.
Fig. 3 below shows our 50th percentile surface wind gust estimates, generated within hours of landfall, along with surface observations. The stronger punch to the left can be seen in both Metryc simulated gusts and surface observations.

Fig. 3: Metryc 50th percentile surface gust winds along with observational records.
Some concluding thoughts
In hindsight, if you had to pick between the NHC and Google track projections 3 days before landfall, it is pretty clear Google was the better choice for this event. While the NHC cone did just about contain the eventual landfall point (Fig. 2), the Google members offered a much closer estimate at that lead time.
But why choose only one?
As with every highly uncertain prediction, there is a lot of value in merging diverse opinions. While arguably pretty spot on in this case, the 50 members DeepMind ensemble is highly constrained and likely under dispersed: i.e. there is a non-zero probability that the eventual track could have fallen outside of the spread.
Reask tools are designed to be more conservative and capture a wider portion of the likely outcomes. They are not a replacement for NHC or DeepMind, but rather a complement that allows objective quantification of each subset of outcomes.
Importantly, Isaias, just like Ian and Milton in the recent past, also showed that the ground level impact of a landfalling Hurricane cannot be fully defined by its track position. We believe that modeling variability in wind field structure and high-resolution interaction with complex terrain is the next milestone for AI-based models. One that will need an increase in horizontal resolution from their current state, along with suitable training data… which will most likely come from high-resolution physics-based models.
To learn more about LiveCyc and Metryc, read the papers linked in the related articles below.
And for some background on left-hand side winds, you can read some past LinkedIn posts by our team:
Why Hurricane Ian’s left-side winds matter for parametric insurance, David Schmid, March 2023
Milton’s peak winds and the myth of the “clean side”, Thomas Loridan, October 2024
How Milton’s wind field could shift damage expectations around Tampa, Jamie Rodney, October 2024
Milton’s surface impacts left of track: gust and power outage data, Thomas Loridan, October 2024