The newsletter for climate-aware risk professionals.
The climate producing today's storms is not the climate that produced the historical record. Join 400+ risk professionals receiving the latest insights from Reask direct to their inbox.

Research
Reask Metryc: a probabilistic wind gust model for tropical cyclone event response with global coverage
The peer-reviewed research behind Metryc: a probabilistic model that estimates wind gusts at 1 km resolution within hours of a tropical cyclone landfall. Tested against more than 500 ground observations across 22 major storms.

Paper title | Reask Metryc: A Probabilistic Wind Gust Model for Tropical Cyclone Event Response with Global Coverage |
|---|---|
Authors | Balaji Mani, Thomas Loridan, Nicolas Bruneau, Nic Hannah, David Schmid (Reask) |
Journal | Journal of Catastrophe Risk and Resilience, Volume 04, Article 05 |
Published | 16 July 2026 |
Peer review | Peer-reviewed. Received June 2025, accepted April 2026 |
DOI | |
Interactive app |
The uncertainty at landfall
National meteorological agencies provide reliable estimates of where a tropical cyclone is heading and how strong it is. But what a specific location experiences depends on more than that: where the strongest winds sit relative to the track, the size and shape of the wind field, and how local terrain changes the gust that reaches the ground.
Most parametric hurricane triggers stand in for these with a proxy, such as distance from the track or a reading from a sensor sited elsewhere. Reask calls the space between what the proxy measures and what the location actually experienced the proxy gap.
Metryc was built to close that gap. It models wind speed at the insured location, at 1 km resolution, for every landfalling storm in the world.
The methodology is now published as peer-reviewed research in the Journal of Catastrophe Risk and Resilience, so the approach behind the trigger can be read, checked, and defended in full.
How Metryc closes the proxy gap
Metryc treats a storm’s track and intensity as fixed inputs from the authoritative agencies that report them (NHC, JTWC, and the WMO regional centres). It then samples the parameters that stay uncertain at landfall and that decide what a specific location experiences.
The system combines three machine learning sub-models, all built on quantile regression forests so they return a full distribution rather than a single estimate:
Wind parameters (BR24). Predicts the radius of maximum winds, the azimuth of the strongest winds, central pressure, and maximum sustained winds from the storm’s track.
Wind field shape (LO17). Reconstructs the spatial pattern of the wind field, including asymmetries such as those seen during extratropical transition in the western Pacific.
Terrain correction. Converts over-water sustained winds into 3-second gusts at ground level, using eight directional sectors so that valleys, forests, and dense urban areas register the sheltering they actually provide.
All three are trained on InCyc, Reask’s global database of 1 km resolution WRF tropical cyclone simulations spanning 1980 to 2020 across every basin.
For each storm, Metryc generates 100 ensemble members. Every member shares the same track and intensity and samples different values for storm size, peak wind location, and wind field shape. The result is a distribution of possible gust footprints for each 1 km cell, summarised as a median footprint and available at other percentiles where a user needs them.
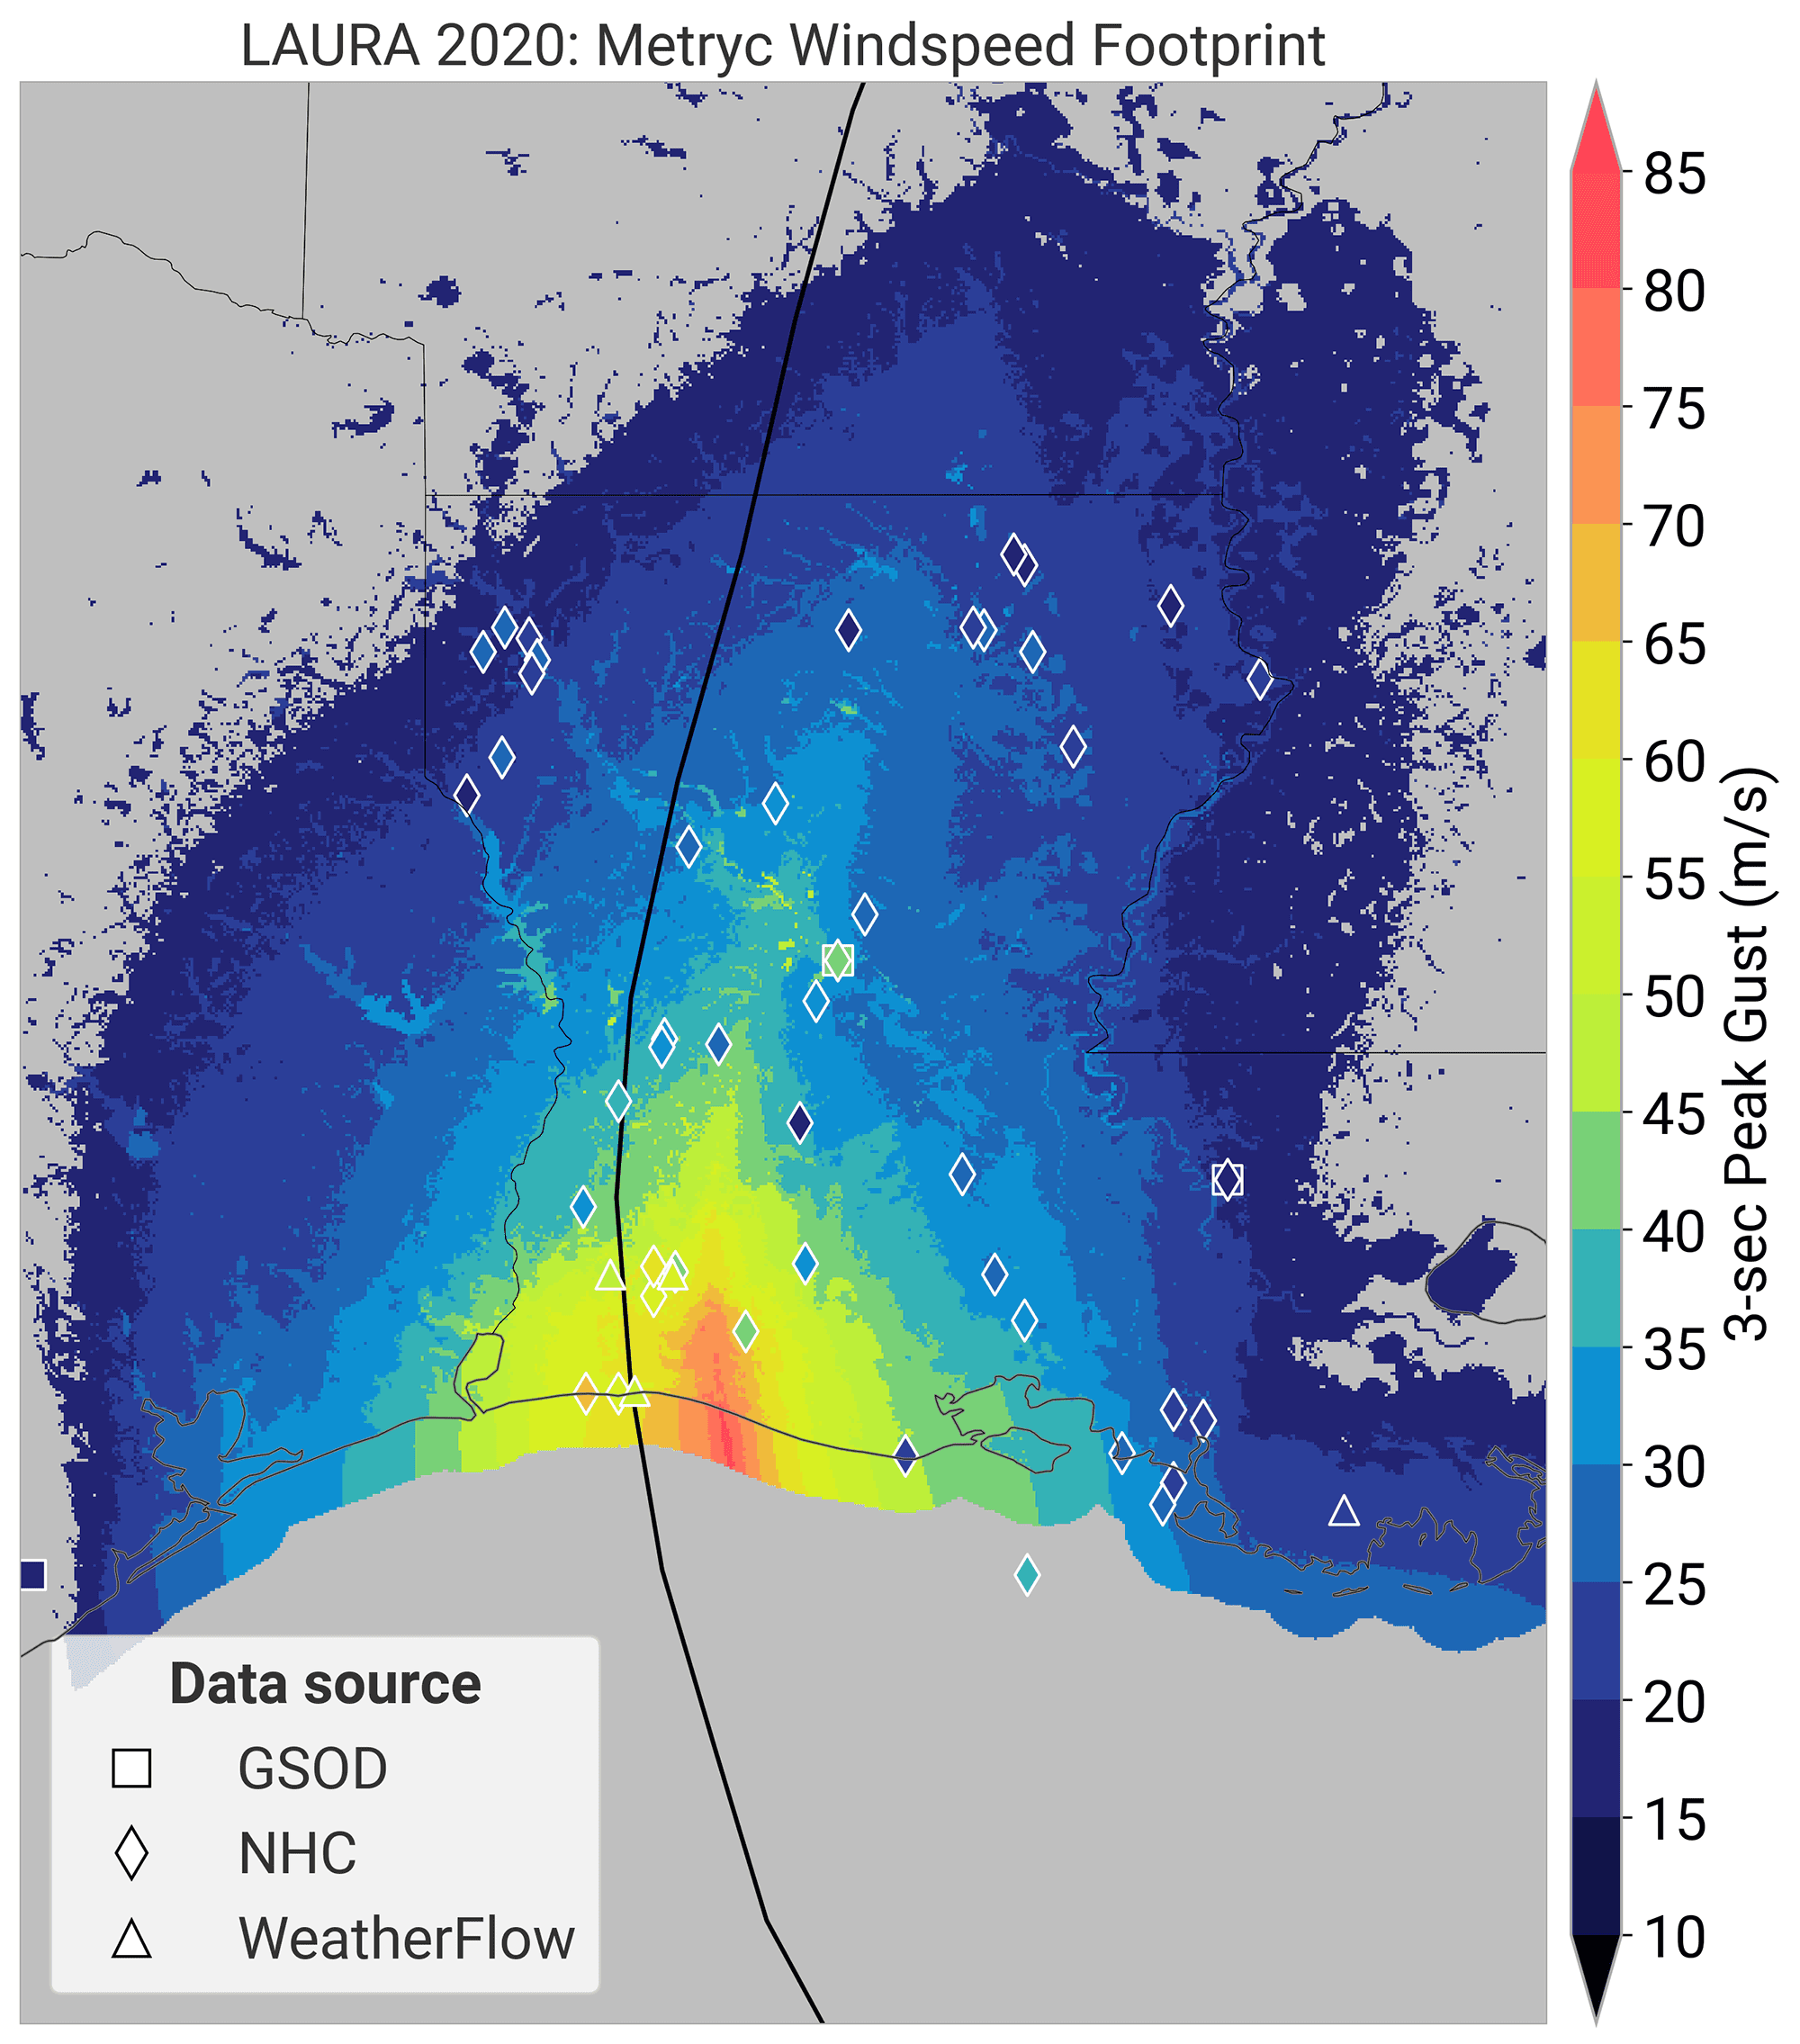
Figure 3: Hurricane Laura (2020) gust footprint. Metryc median 3-second peak gust footprint for Hurricane Laura (2020), with the IBTrACS storm track and surface observation stations overlaid. Source: Mani et al. (2026), CC BY 4.0.
Terrain is why two nearby locations differ
Two locations a short distance apart can experience the same storm very differently, because terrain shapes what reaches the ground. The paper states this directly: locations sheltered in valleys, or surrounded by forest or dense urban development, register weaker winds than open ground nearby. Metryc’s terrain correction sub-model captures that effect at 1 km resolution across eight wind directions.
What the evaluation found
The paper tests Metryc against more than 500 quality-controlled surface observations from 22 major landfalls between 2016 and 2023, across the United States, Japan, and Australia.
For the 10 US cases, modelled gusts fall within 10 m/s of the observation at 89% of stations, with a root mean square error of 6.66 m/s.
For the 10 Japanese cases, the figure is 87% of stations within 10 m/s, with a root mean square error of 6.38 m/s.
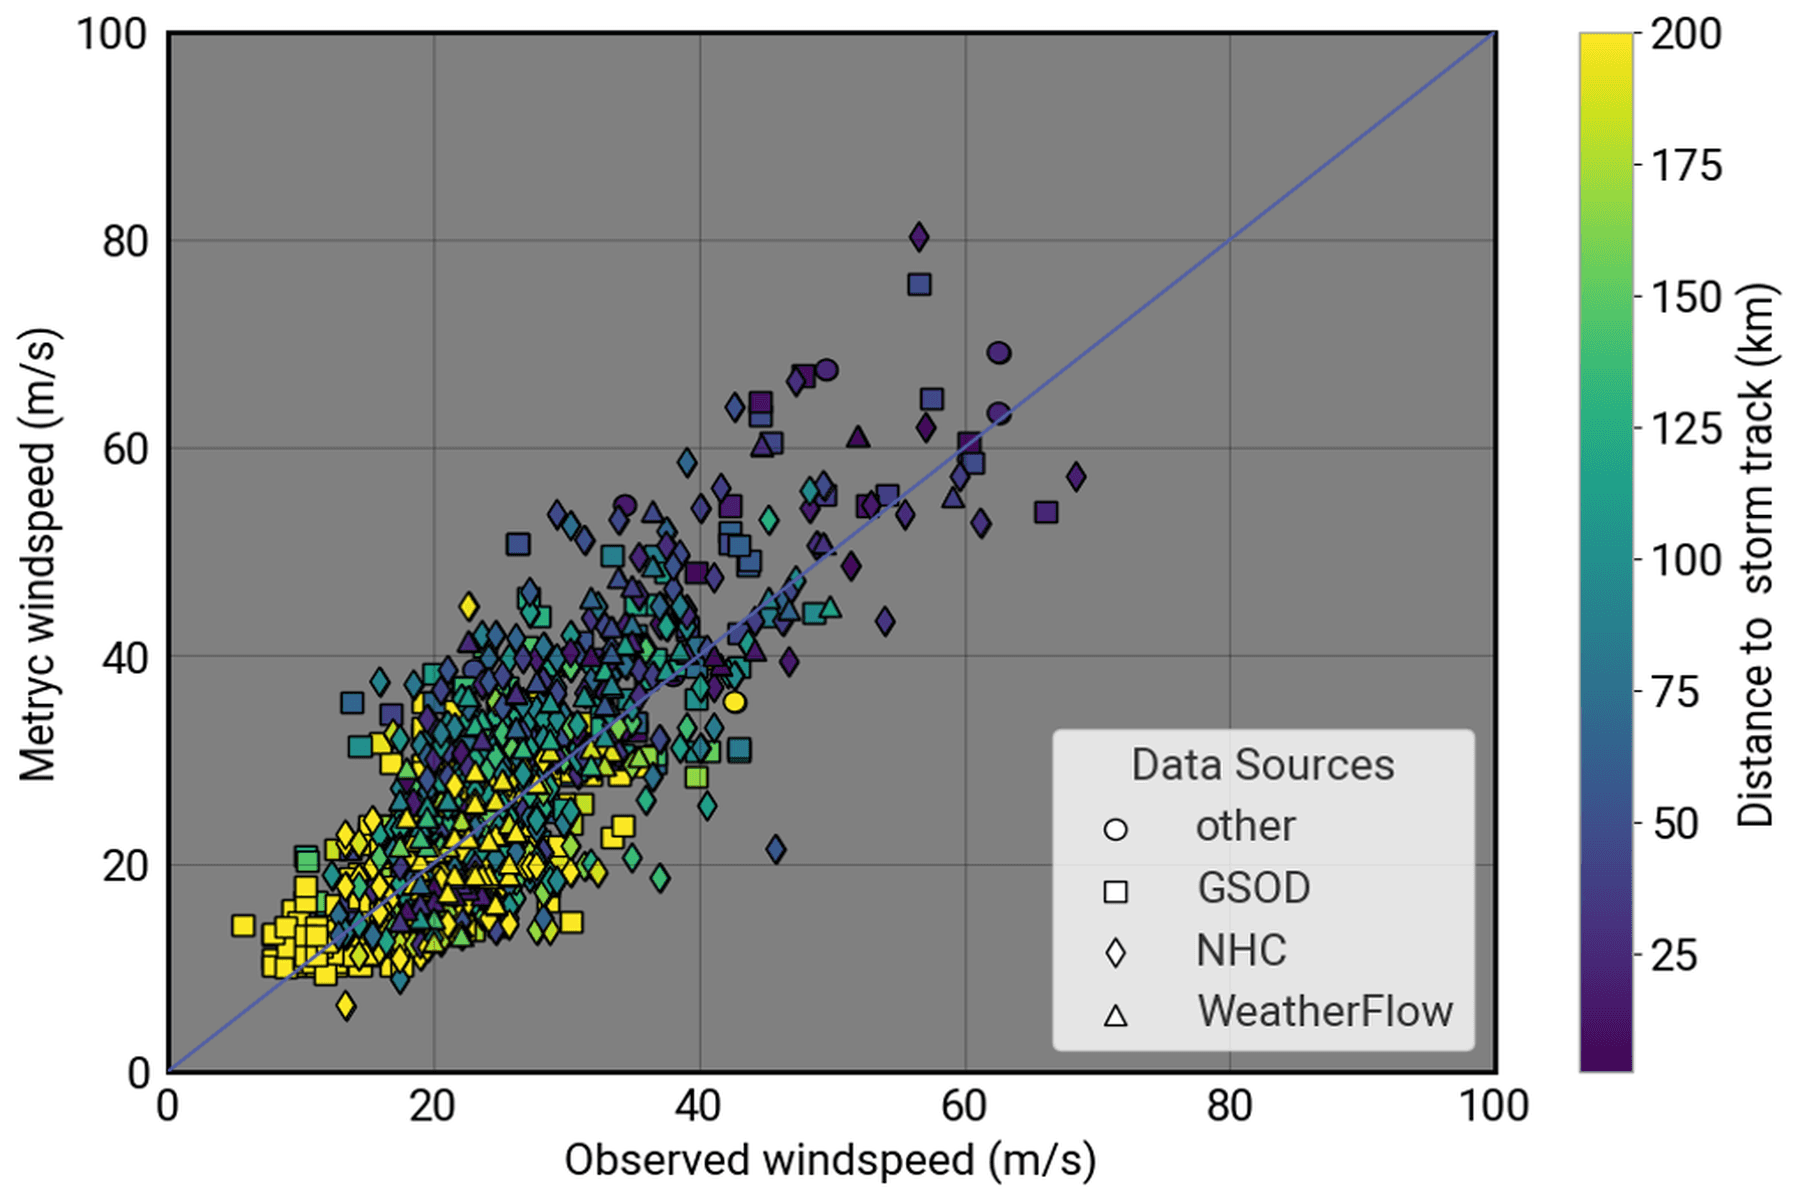
Figure 7a: Modelled vs observed gusts, US storms. Observed against Metryc-simulated peak wind gust for the 10 US storms in the validation set. Source: Mani et al. (2026), CC BY 4.0.
A global catalogue that makes back-testing consistent
Running the same method on best-track data from IBTrACS, Metryc has produced a catalogue of more than 929 historical wind gust footprints at 1 km resolution, covering category 1 and stronger landfalls back to 1945.
The footprints in that catalogue are built with the same models and sampling strategy as the ones generated live at landfall. That consistency is what lets an impact model be back-tested across decades of events and then deployed with confidence during the next storm.
The paper gives examples, including overlaying wind gusts with claims, property damage, and emergency call volumes to build predictive impact models.
Where Metryc is used today
Metryc underpins several parametric insurance products for both private and public bodies, including work with Swiss Re, AXA Climate, Descartes, and the Pacific Catastrophe Risk Insurance Company (PCRIC). The PCRIC scheme is people-focused: payouts scale to the number of people affected, which gets liquidity to small-island member states quickly after a storm.
Explore the footprints
All 22 evaluation storms from the paper can be explored in the interactive application below.